Fig. 2.
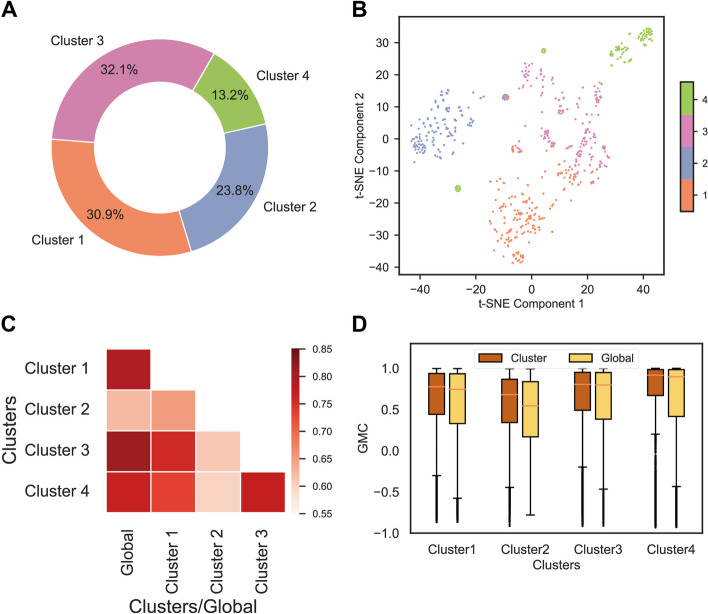
K-means clustering of Camellia sinensis RNA-seq samples and comparative analysis of global vs. cluster-specific co-expression modules. (A) Pie chart showing the proportion of k-means clusters. (B) Scatter plots of t-SNE show the spatial distribution of all Camellia sinensis RNA-seq samples on Component 1 and Component 2. Different clusters are distinguished using different colors, while the same cluster remains consistent across A and B. (C) Similarity analysis of global and cluster-specific co-expression modules. The intensity of colors in the heatmap represents the magnitude of the Fowlkes-Mallows score (FMS). (D) Comparison of the gene-module consistency coefficient (GMC) of all genes between the global module and the cluster-specific module for each cluster

