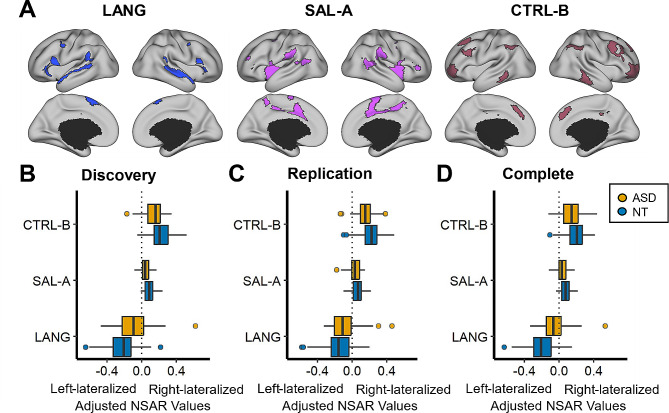
Fig. 1.
Group differences in network lateralization. Panel A depicts an individual parcellation from a neurotypical subject of three networks for which group differences in lateralization were identified. These networks include the Language (LANG), Salience/Ventral Attention-A (SAL-A), and Control-B (CTRL-B) networks. Panels B-D depict three networks on the y-axis and model-adjusted NSAR values on the x-axis, with negative values representing left hemisphere lateralization and positive values representing right hemisphere lateralization. NSAR values were adjusted by regressing out the effects of mean-centered age, mean-centered mean framewise displacement, and handedness using the following formula: NSARadjusted = NSARraw - [β1(mean-centered ageraw - mean of mean-centered ageraw) + β2(mean-centered FDraw - mean of mean-centered FDraw) + β3(groupraw - mean groupraw) + β4(handednessraw - mean handednessraw)]. NSAR adjustment occurred separately for each network and each group. A significant group effect on lateralization was found for three networks following Bonferroni correction in the Discovery dataset: Language (t(92) = -3.18, p-adjusted = 0.02), Salience/Ventral Attention-A (t(92) = 3.82, p-adjusted = 0.002), and Control-B (t(92) = 3.06, p-adjusted = 0.02). Significant group differences in lateralization for the Language (t(92) = -2.44, p-adjusted = 0.05) and Control-B (t(92) = 2.55, p-adjusted = 0.04) networks were replicated in the Replication dataset. In the Complete dataset, group differences in lateralization were identified for the Language (t(113) = -4.69, p-adjusted < 0.001), Salience/Ventral Attention-A (t(113) = 2.89, p-adjusted = 0.01), and Control-B (t(113) = 2.71, p-adjusted = 0.02) networks

