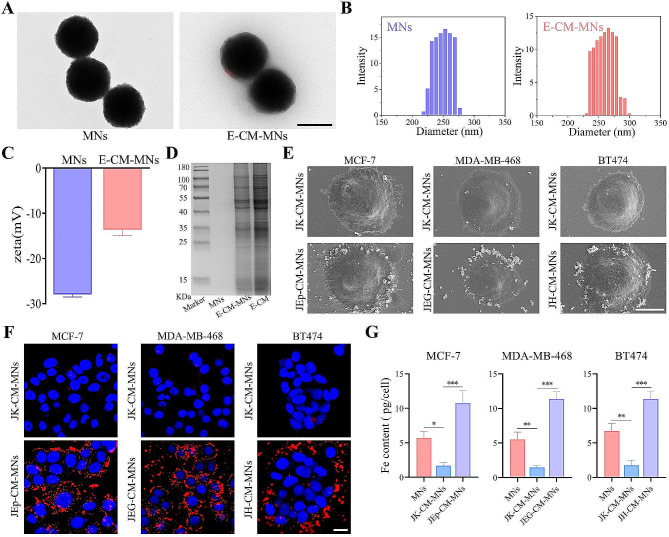
Fig. 2.
Characterization of E-CM-MNs. (A) TEM images of MNs and E-CM-MNs. Scale bar, 200 nm. (B) Size distribution and (C) zeta potential of MNs and E-CM-MNs. Data represent as mean ± s.d. (n = 4). (D) SDS-PAGE protein analysis of MNs, E-CM-MNs and E-CM. (E) SEM images of tumor cells incubated with different CM-MNs. Scale bar, 10 μm. (F) Fluorescence images of the interaction between various CM-MNs and different cells. Scale bar, 20 μm. (G) ICP-OES detection of the interaction between various nanoparticles and different cells. Data represent as mean ± s.d. (n = 3). *p < 0.05, **p < 0.01, ***p < 0.001

