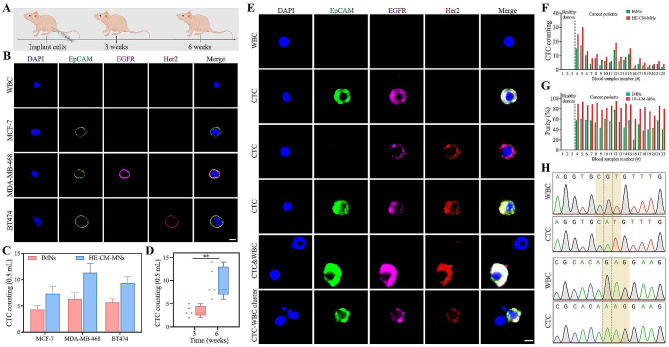
Fig. 5.
Detecting CTCs using IMNs or HE-CM-MNs. (A) Schematic design of mouse cancer models. (B) Representative images of captured CTCs and a normal mouse cell. Scale bar, 5 μm. (C) CTC counting in six weeks mouse cancer models. Data represent as mean ± s.d. (n = 3). (D) CTC counting using HE-CM-MNs in xenograft models at different time periods. Data represent as mean ± s.d. (n = 5). **p < 0.01. (E) Representative images of captured cells by HE-CM-MNs. Scale bar, 5 μm. (F) CTC counting and (G) capture purity in cancer peripheral blood. (H) Sanger sequencing results. The 818G/A (R273H) and 853G/A (E285K) point mutation were detected at the single cell level

