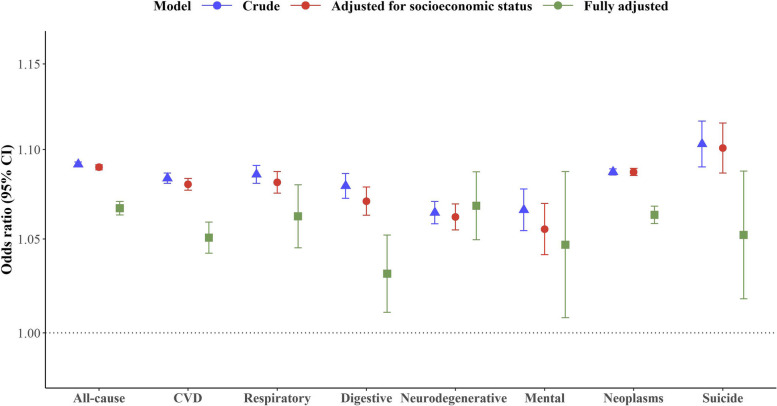
Fig. 2.
Cumulative odds ratio of all-cause and cause-specific mortality associated with per unit increase in flood index over lag years 0–5. Estimates of risk were obtained from the crude model that only included flood (crude); the multivariate model that additionally controlled for socioeconomic status (education attainment, household income, and deprivation); and the full model that additionally adjusted for BMI, physical activity, smoking, alcohol consumption, suboptimal diet, overall health rating, mean temperature, mean relative humidity, and assessment centre which serves as an indicator of the recruitment location for each participant (fully adjusted). The error bars represent 95% confidence intervals

