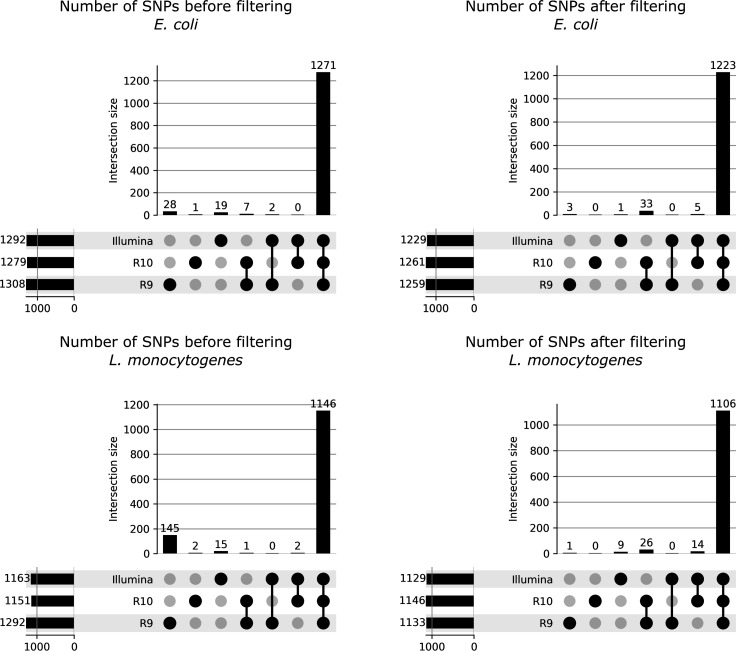
Fig 3.
UpSetPlots showing the overlap in SNPs between different sequencing technologies/chemistries before and after filtering. Plots show the size of the intersection of the detected SNPs between the sequencing technologies/chemistries across all isolates. The results for E. coli and L. monocytogenes are shown in the top and bottom rows, respectively. The results before and after SNP filtering are shown on the left and right sides, respectively. The size of the vertical bars indicates the size of the intersection between technologies/chemistries, as indicated by the black dots and connecting lines below the bars. For example, the leftmost bar in each sub-plot indicates the number of SNPs uniquely detected in the R9 data sets across all isolates of the corresponding species, whereas the rightmost bar in each sub-plot indicates the number of SNPs shared for both the Illumina, R9 and R10 data sets across all isolates of the corresponding species. The horizontal bars represent the total number of SNPs detected for each technology/chemistry. SNPs were considered to overlap between technologies if the same alternate base at the same chromosomal position was called in the corresponding data sets. Combinations with no overlap (i.e., zero SNPs uniquely shared between the corresponding sequencing technologies/chemistries) were still shown to ensure visual consistency between sub-plots. Note that these values were calculated based on the SNPs called in regions that passed region filtering, as described in Variant Calling and Filtering, and Phylogenetic Tree Reconstruction. Plots were generated using the UpSetPlot (v.0.8.0) python package.

