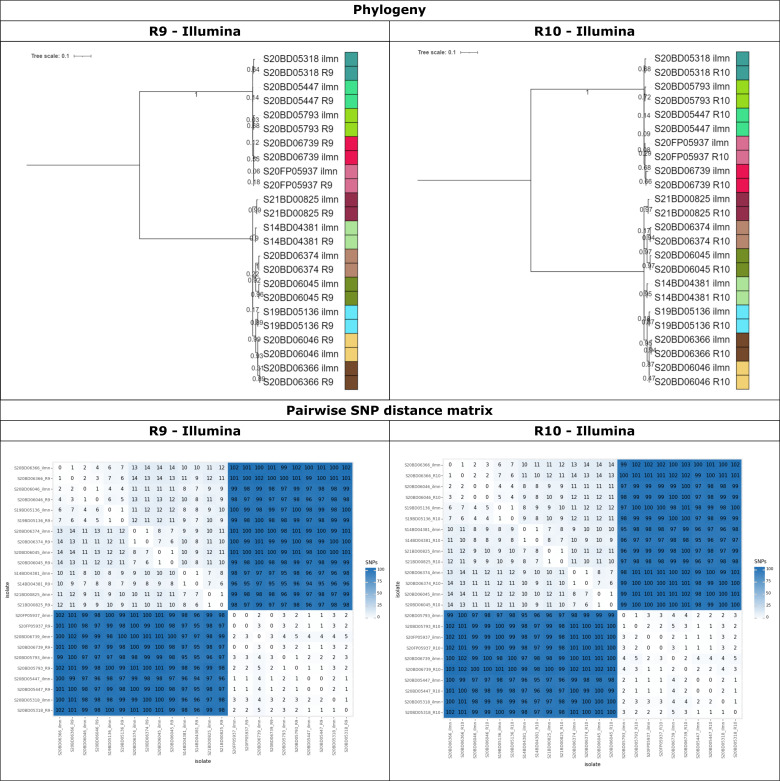
Fig 6.
Mixed SNP phylogeny of the L. monocytogenes Illumina and R9/R10 data sets. These plots show the maximum likelihood SNP phylogeny including all L. monocytogenes data sets sequenced with Illumina and R9 (left panel), and Illumina and R10 (right panel). The top row shows the maximum-likelihood phylogenies. Branch lengths and the scale bar are expressed as average substitutions per site. Node labels indicate the bootstrap support for the corresponding node. Replicates of the same isolate sequenced with different technologies are indicated by the colors on the right side of the phylogeny (the “R9,” “R10,” and “ilmn” suffixes, respectively, refer to ONT R9, ONT R10, and Illumina). The bottom row shows the pairwise SNP distance matrices.

