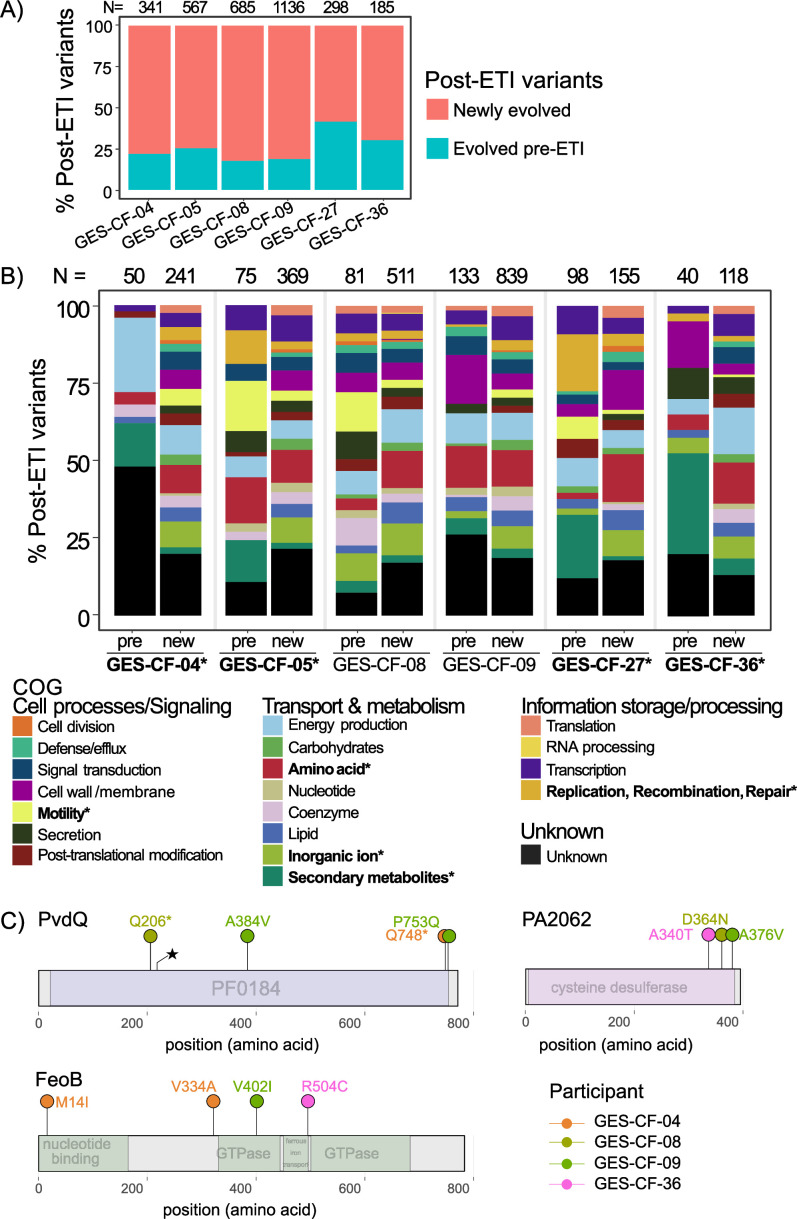
Fig 2.
(A) Most post-ETI variants were not previously detected pre-ETI. Red = proportion of post-ETI variants that were never detected pre-ETI in each study participant. Teal = proportion of post-ETI variants that were also present in pre-ETI populations. The numbers above each bar are the counts of unique post-ETI variants, including those in intergenic regions. (B) Functional categories of newly evolved variants differ from variants that had evolved pre-ETI. Bars show the proportion of post-ETI variants that are assigned to each functional category (COG) by eggNOG. For each participant, left bar (pre) =post-ETI variants that were previously detected pre-ETI. Right bar = post-ETI variants that were newly evolved post-ETI (new). The numbers above each bar are the counts of unique post-ETI variants within coding regions of genes that were either present pre-ETI or newly evolved post-ETI. Bolded labels with asterisks on the COG category labels indicate categories that significantly differed within at least one study participant (Fisher’s exact test, P < 0.05). Bolded labels with asterisks on participant labels indicate individuals whose COG categories were significantly different (Fisher’s exact test, P < 0.05). (C) Lollipop diagram of genes that were mutated post-ETI, but not pre-ETI, in three or more study participants. Colors of variants indicate the study participant in which each mutation was detected.

