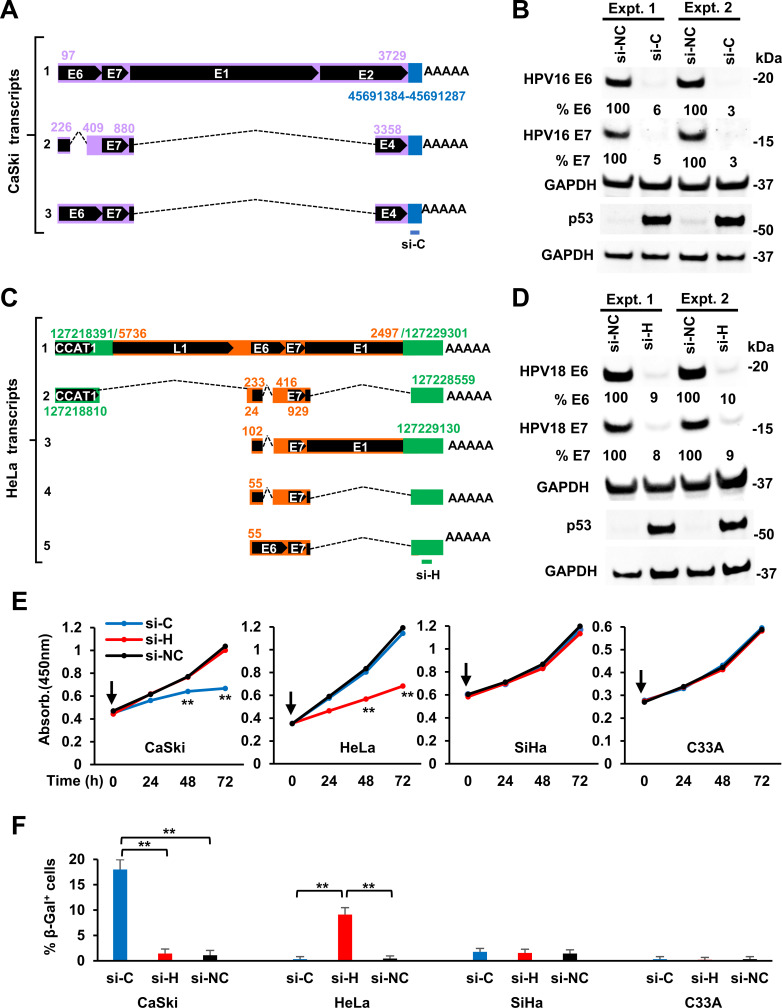
Fig 5.
Inhibition of viral E6 and E7 expression and cell proliferation and promotion of cell senescence by specific siRNAs targeting to the host portion of virus-host fusion RNAs from a single HPV DNA integration site in HPV16+ CaSki and HPV18+ HeLa cells. (A and C) Diagram showing the specific targeting sites of siRNAs, si-C for CaSki (A) and si-H for HeLa RNAs (C). (B and D) Specific siRNAs targeting CaSki (si-C) or HeLa (si-H) host portion of the virus-host fusion transcripts inhibit the expression of viral E6 and E7 proteins but stabilizing p53 in HPV16+ CaSki (B) and HPV18+ HeLa cells (D). Cell lysates were prepared 48 h after transfection of si-C for CaSki and si-H for HeLa cells, along with non-specific siRNA control (si-NC). The relative HPV E6/E7 and p53 protein levels in each sample were immunoblotted by corresponding antibodies. The signal intensity of each viral protein band was quantified after normalizing with GAPDH serving as the protein loading control. (E and F) The siRNAs specific to CaSki (si-C) or HeLa (si-H) portion of the host-virus fusion RNAs inhibited cell proliferation (E) but promoted cell senescence (F). HPV16+ SiHa and HPV− cervical cancer cells C33A served as cell line controls and si-NC as a siRNA control. A CCK-8 cell proliferation assay was applied to examine the cell proliferation at the indicated time (H) after cell transfection once (time zero, vertical arrow) with 40 nM of individual siRNAs. The viable cell numbers (mean ± SE from three experimental repeats) in each group were measured by absorbance at 450 nm (E). Cell senescence was examined by β-Gal staining (F) at day 8 for the indicated cells transfected twice with 40 nM of siRNA in a 72-h interval after first siRNA transfection. The senescent cells with perinuclear blue staining beyond the background level from each experimental group were counted from ~100 cells from six random fields and averaged (mean ± SE) from three independent experiments (F). **P < 0.01 by Student’s t-test.

