Fig 3.

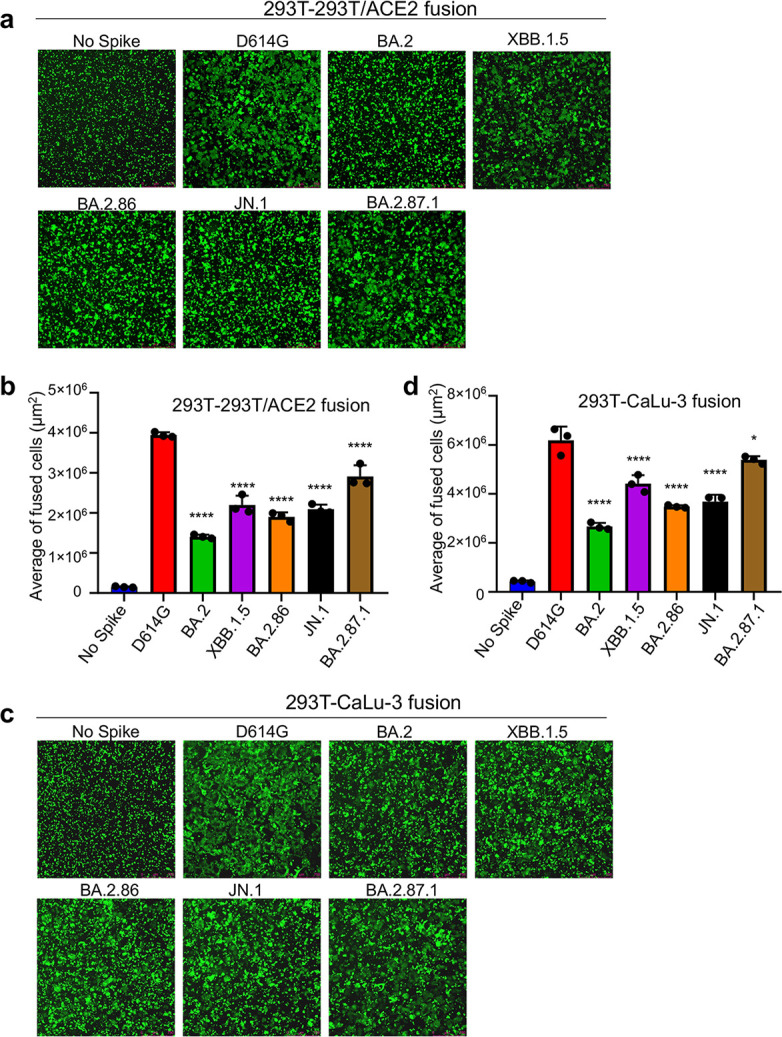
Cell-Cell fusion of BA.2.87.1 and JN.1 spikes alongside other SARS-CoV-2 variants in 293T-ACE2 and CaLu-3 cells. HEK293T cells were co-transfected with plasmids of indicated spikes together with GFP and were cocultured with 293T-ACE2 (a and b) or human lung epithelial CaLu-3 cells (c and d) for 6.5 h (HEK293-ACE2) or 4 h (CaLu-3). Cell-cell fusion was imaged and GFP areas of fused cells were quantified (see Methods). D614G and no spike served as positive and negative control, respectively. Comparisons of the extent of cell-cell fusion were made for each Omicron subvariant against D614G. Scale bars represent 150 µM. Bars in (b and d) represent means ± standard error. Dots represent three images from two biological replicates. Statistical significance relative to D614G was determined using a one-way repeated measures ANOVA with Bonferroni’s multiple testing correction (n = 3). P values are displayed as ns P > 0.05, *P < 0.05, and ****P < 0.0001.
