
Figure 6: Data processing: 20210804 Propionylated Standard Histones Mix_QC Peptide.
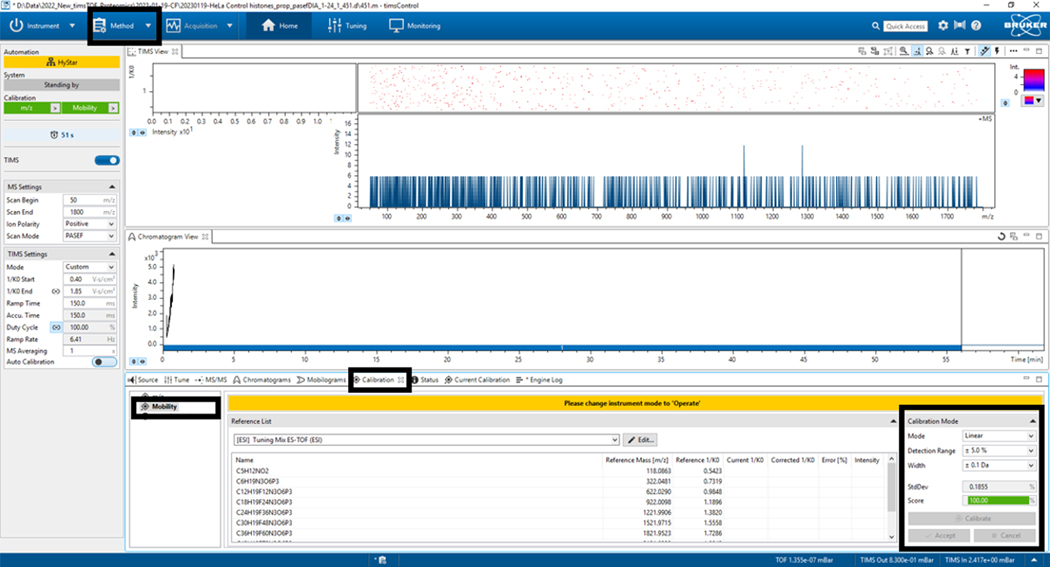
Before starting to process the data, make sure to prepare the theoretical list of possible charge states and their fragmentations (1550.9013; 775.9543; 517.6386; etc.) to extract those values from the base peak chromatogram (BPC +All MS). After extracting each peptide, make sure it looks like the analysis list shown in the figure. The peak 775.9543 was selected as an example. On the right side of the figure, three graphs are shown: the first corresponds to the chromatogram (intensity vs. time graph), the second to the mobilogram, and the third to the mass spectrum with PASEF fragmentation included.