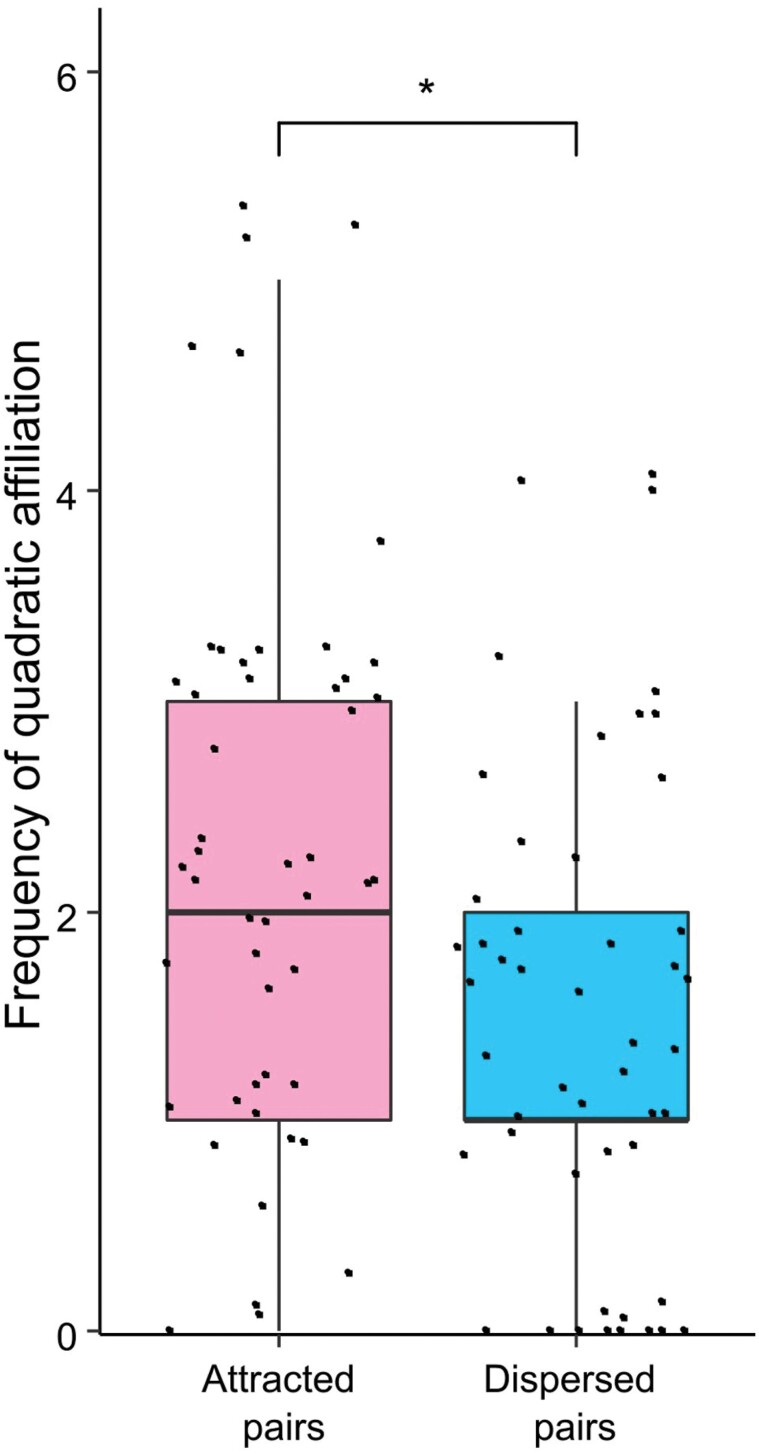
Figure 2.
Differences between attracted and dispersed pairs (Wilcoxon signed-ranks test: Npigs = 49, T = 310.00, ties = 6, P = 0.047). Horizontal lines: medians; box length: interquartile range; vertical line: minimum and maximum values in the data; points: data value distribution. NS = non significant; * = P < 0.05.

