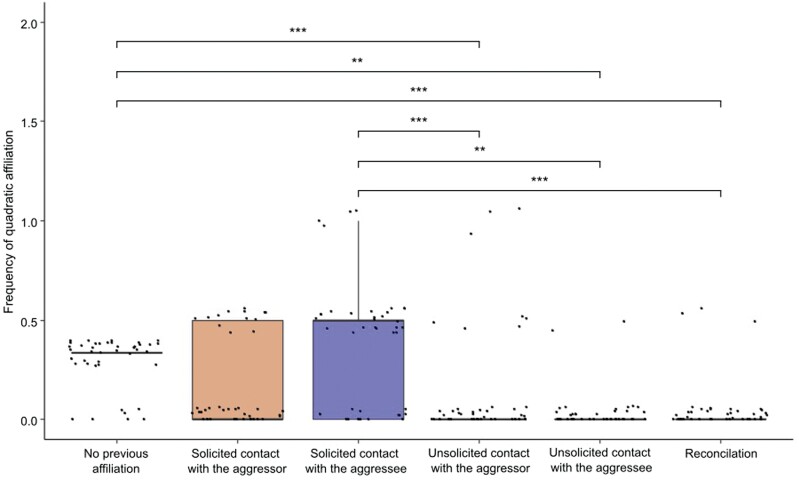
Figure 5.
Differences in levels of quadratic affiliation across different conditions involving the previous presence of different types of post-conflict affiliation (reconciliation, QR; solicited/unsolicited contacts with the aggressee, QSV/QUV; solicited/unsolicited contacts with the aggressor, QSA/QUA) or no previous affiliation (QNP): 1) QNP than in QUV (Q = −1.841, P < 0.001); 2) QNP than QUA (Q = −1.329, P = 0.019); 3) QNP than QR (Q = −1.780, P < 0.001); 4) QSV than QUV (Q = −2.024, P < 0.001); 5) QSV than QUA (Q = 1.512, P = 0.004); 6) QSV than QR (Q = −1.693, P < 0.001). No difference was found between other conditions (QUV vs. QR, Q = 0.061, P = 1.000; QUV vs. QUA, Q = −0.512, P = 1.000; QUV vs. QSA, Q = −0.902, P = 0.434; QR vs. QUA, Q = −0.451, P = 1.000; QR vs. QSA, Q = −0.841, P = 0.626; QUA vs. QSA, Q = −0.390, P = 1.000; QSA vs. QNP, Q = −0.939, P = 0.346; QSA vs. QSV, Q = 1.122, P = 0.099; QSV vs. QNP, Q = 0.183, P = 1.000). Horizontal lines: medians; box length: interquartile range; vertical line: minimum and maximum values in the data; points: data value distribution. NS = non-significant; ** = P < 0.01, *** = P < 0.001.

