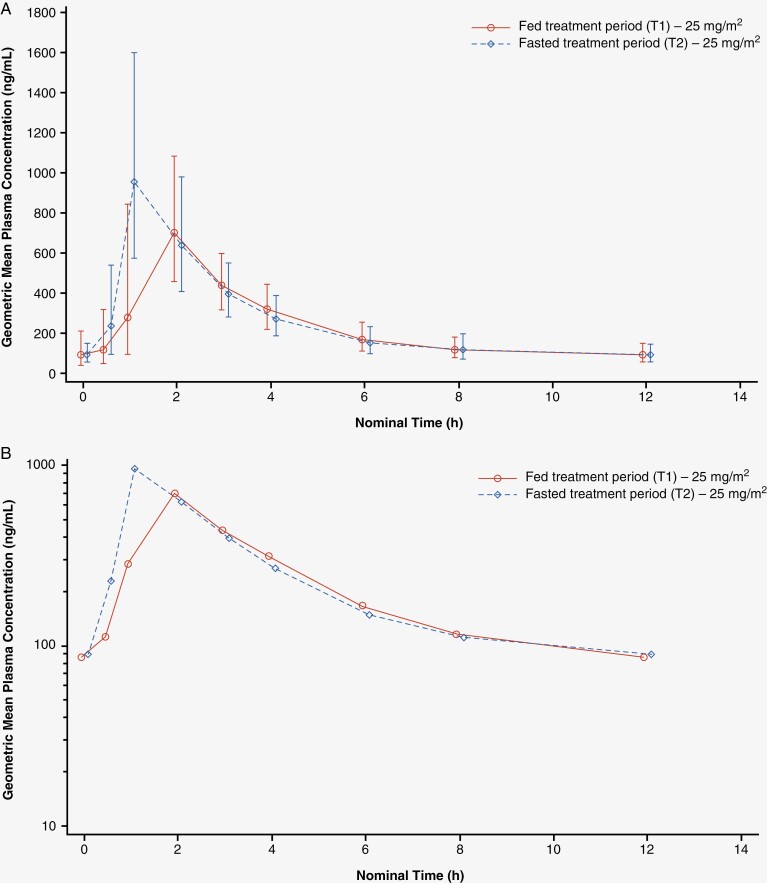
Figure 2.
Geometric mean plasma concentrations of selumetinib versus time—multiple dose (A. Linear; B. Semi-logarithmic).a
aClinically implausible high concentrations of selumetinib were reported for 3 participants at 12 h post-dose in the fasted treatment period. The plasma concentration–time profiles for each participant from the last timepoint with a measurable concentration (8 h) to 12 h post-dose to estimate the AUC0–12,SS values were extrapolated. As the percentage extrapolation was small, and to maximize the data used in the statistical assessment of food effect, the AUC0–12,ss values for these 3 participants' T2 selumetinib profiles were considered to be representative of the primary endpoint parameter and, therefore, were included in the statistical analysis. AUC0–12,ss, area under the concentration–time curve from time zero to 12 h at steady state.

