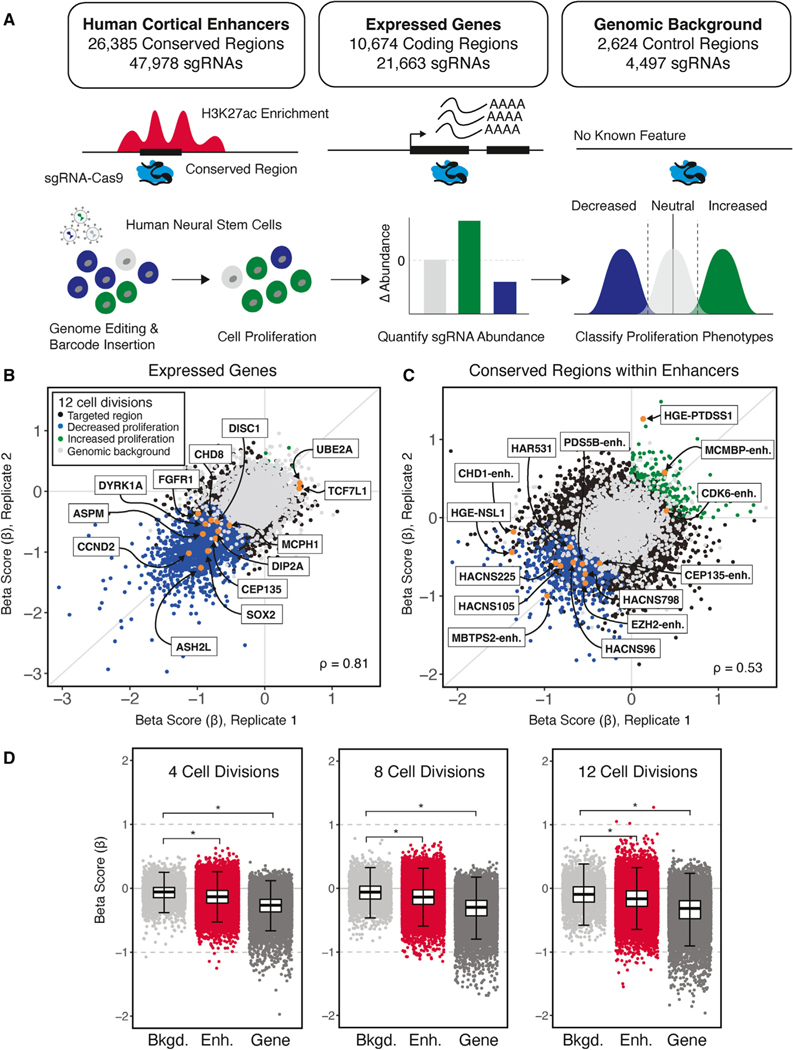
Figure 1. Identifying genes and enhancers that alter human neural stem cell (hNSC) proliferation following genetic disruption.
(A) Top: summary of conserved regions within enhancers, genes, and background control regions targeted in the sgRNA-Cas9 genetic screen. Putative TFBSs within enhancers were identified based on the 46-species Placental Mammal PhastCons element annotation (GRCh37/hg19; STAR Methods). Each PhastCons element was divided into approximately 30-bp conserved regions and targeted for genetic disruption by sgRNAs. Genes were targeted based on evidence of expression in hNSCs. Genomic background controls are non-coding regions with no detectable evidence of regulatory activity based on epigenetic signatures (STAR Methods). Bottom: schematic transduction of sgRNA-Cas9 lentiviral libraries into hNSCs at a low MOI (~0.3) to ensure that cells were infected by a single virion, and, on average, 1,000 cells were infected per sgRNA. Changes in the abundance of each sgRNA over time and classification of proliferation phenotypes was carried out as described in the main text.
(B and C) Scatterplots illustrating beta scores (β) for two biological replicates resulting from genetic disruption of genes (B) and conserved regions within enhancers (C), measured at 12 cell divisions following transduction. Each point shows the effect of individual sgRNAs assigned to a protein-coding gene or conserved region within an enhancer relative to non-targeting controls for each biological replicate, as indicated in the legend shown in (B). Gene and enhancer disruptions affecting proliferation in regions with known biological roles in NSCs are identified by name (orange). Examples of genes were selected based on NSC maintenance or association with neurodevelopmental disorders. Enhancer examples were selected based on evidence of a regulatory interaction with genes with roles in chromatin modification and association with neurodevelopmental disorders or their identification as an HAR or HGE. Spearman correlations between replicates for gene (B) and conserved-region disruptions (C) are shown at the bottom left.
(D) Distribution of proliferation phenotypes resulting from disruption of genomic background control regions (light gray), enhancers (red) and genes (dark gray) at 4, 8, and 12 cell divisions. Boxplots illustrate the lower (25th percentile), middle (50th percentile), and upper (75th percentile) of beta scores for each category. Each point shows the jointly modeled effect across biological replicates for all sgRNAs assigned to a protein-coding gene or conserved region within an enhancer relative to non-targeting controls. Error bars indicate an estimated 95% confidence interval. *p < 2.2 × 10⁻¹⁶, Mann-Whitney U test.

