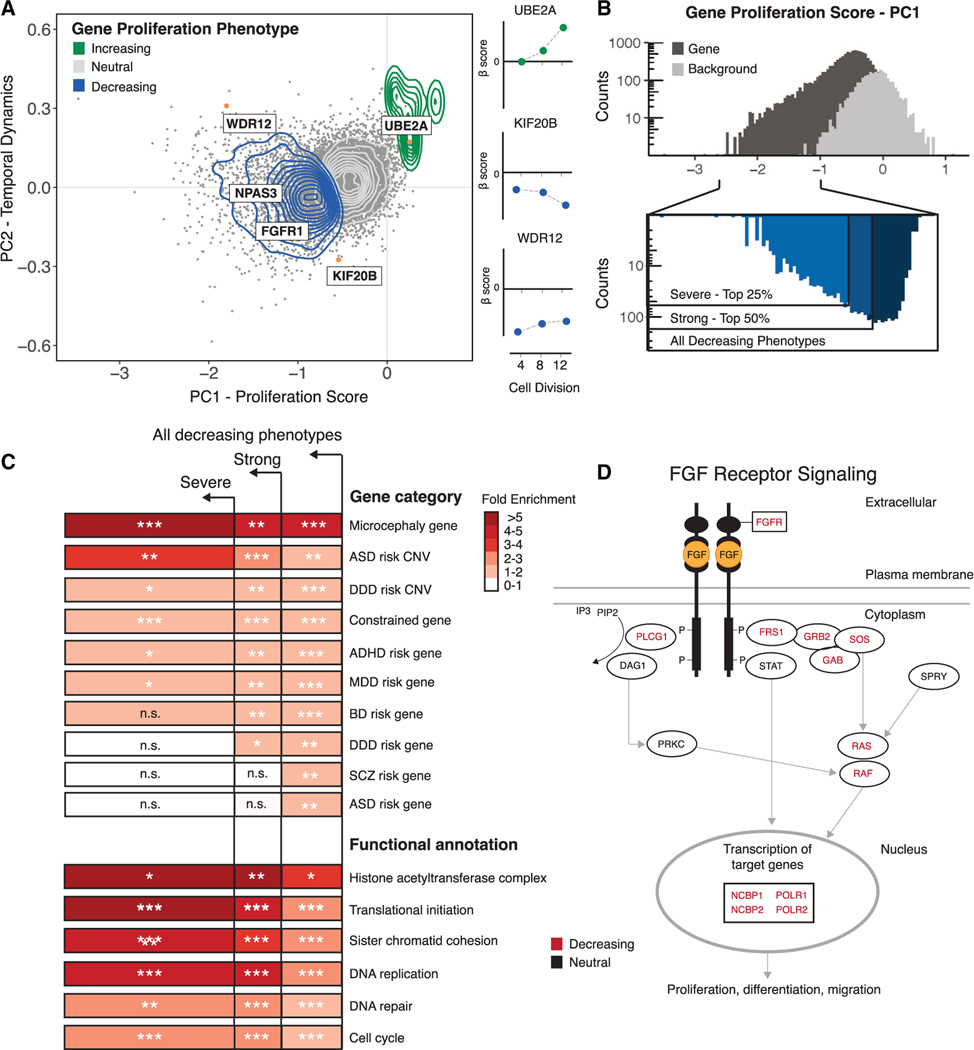
Figure 2. Characterization of gene proliferation phenotypes.
(A) Left: principal-component analysis (PCA) of all gene disruptions, with a 2D density overlay illustrating the distribution of proliferation-decreasing (blue), neutral (gray), and proliferation-increasing (green) phenotypes and individual gene disruptions (orange) with biological roles in the maintenance of NSCs or human neurodevelopment; see text for details. Right: temporal dynamics captured by PCA shown at 4, 8, and 12 cell divisions.
(B) Top: histogram of proliferation scores obtained from PCA for gene disruptions (black) and genomic background controls (gray). Bottom: partitioning of all gene disruptions that decrease proliferation into severe (top 25%) and strong (top 50%) categories.
(C) Fold enrichment of GO biological processes and risk gene sets within the partitions shown in (B). n.s., not significant. Hypergeometric BH-corrected p values are as follows: *p < 0.05, **p < 0.005, ***p < 0.0005.
(D) FGF signaling pathway (Reactome: R-HSA-1226099); see text for details. Genes disrupted within this pathway are shown in black, and a significant subset (BH-corrected p = 2.8 × 10⁻²) results in proliferation phenotypes (red).

