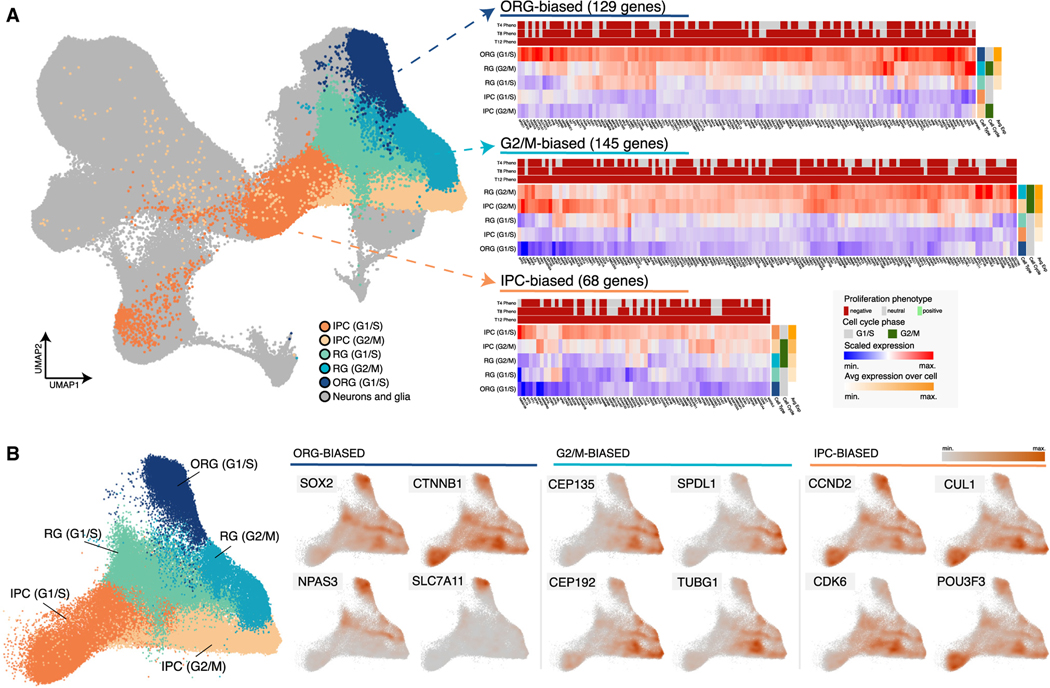
Figure 6. Progenitor-type-specific expression of gene hits in the developing human cortex.
(A) Left: UMAP representation of the developing human cortex single-cell gene expression atlas used for our analysis. Five cortical progenitor types are annotated: outer radial glia (ORG) cells in G1/S phase, intermediate progenitor cells (IPCs) in G1/S or G2/M phase, and radial glia (RG) in G1/S or G2/M phase. Right: heatmaps showing the average scaled expression for genes with proliferation phenotypes that exhibit progenitor-type-specific expression patterns. Three clusters are presented: one with genes showing ORG-biased expression (129 genes, cluster 2 in Table S13), one with genes showing G2/M-biased expression (145 genes, cluster 6 in Table S13), and one with genes showing IPC-biased expression (68 genes, cluster 1 in Table S13). The proliferation phenotype for each gene at 4, 8, and 12 cell divisions is shown above each heatmap. The inferred cell cycle phase for each progenitor cell type is shown on the right, as is the average expression of all genes in each cluster. See the legend at the bottom right for details.
(B) Left: UMAP representation of cortical progenitors in the developing human cortex gene expression atlas with other cell types removed. Progenitor cell types and inferred cell cycle phases are labeled and colored as in (A). Right: UMAP representations displaying the scaled density of expression for individual genes in each cluster shown in (A).

