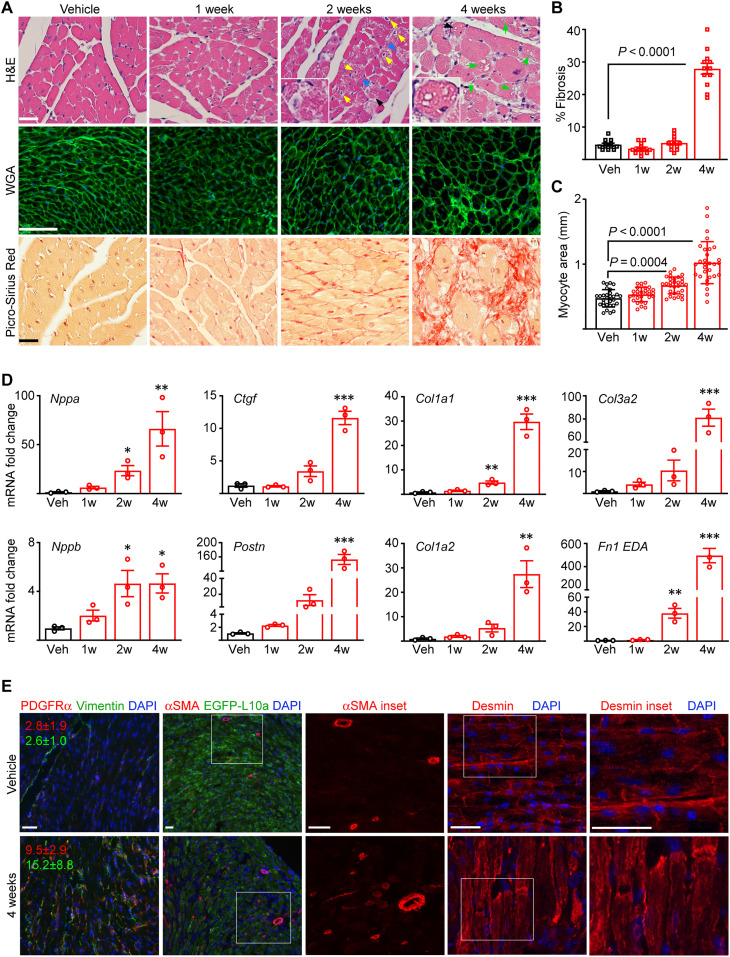
Fig. 2. Pathological cardiac remodeling accompanies cardiac dysfunction.
(A) Histological analyses of the hearts from CM-CreTRAP:Lmnaflox/flox mice at 1, 2, and 4 weeks after Tam or Veh treatment. Blue, yellow, and green arrows denote degenerating myocytes, pyknotic nuclei, and vacuolation, respectively. Black arrows denote insets. H&E, hematoxylin and eosin; WGA, wheat germ agglutinin. Scale bars, 50 μm. A representative image per group (n = 3) are shown. (B) Quantitation of average % fibrosis of Masson’s trichrome staining from 12 independent images from three mouse hearts per group. Error bars = SEM. % Fibrosis P value was determined using one-way ANOVA and Dunnett’s correction with Veh as control. (C) Quantitation of myocyte cross-sectional area based on WGA staining. Three images were taken per section, and average area of 30 individual CMs was measured in total per group across three experiments. Error bars = SD. P values were determined using one-way ANOVA and Dunnett’s correction with Veh as control. (D) qPCR of cardiac stress and profibrotic markers in hearts of Tam-treated CM-CreTRAP:Lmnaflox/flox mice. 1w to 4w denote weeks after final Tam dosing. Data are presented as fold change relative to Veh. *P < 0.05, **P <0.01, and ***P < 0.0001 using one-way ANOVA with Dunnett’s correction with Veh as control. Error bars = SEM. n = 3. (E) Immunofluorescence images of platelet-derived growth factor receptor α (PDGFRα), vimentin, α–smooth muscle actin (αSMA), EGFP-L10a, and desmin on mouse hearts 4 weeks after Veh or Tam treatment. The red and green numbers in line with the PDGFRα and vimentin micrographs denote their quantitation (% area per field ± SEM), respectively, calculated from 15 images from three mice per group across three replicate experiments. White boxes denote magnified insets shown to the right. Scale bars, 50 μm. Data from both sexes are shown in this figure.

