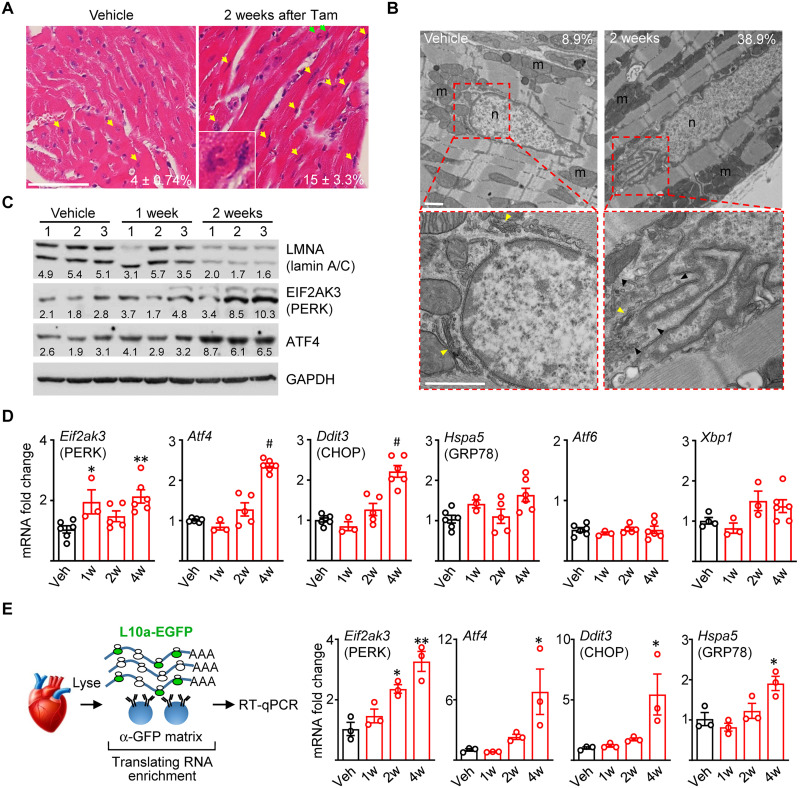
Fig. 3. Selective UPR activation in Lmna-deleted hearts.
(A) H&E staining of longitudinal heart sections from CM-CreTRAP:Lmnaflox/flox mice 2 weeks after Veh or Tam. Yellow arrows highlight abnormally shaped, ruptured, and stretched nuclei with green arrows showing inset. Average number ± SEM of abnormal nuclei per field counted from 15 fields from three mice per group from three experiments are shown. (B) TEM on hearts from CM-CreTRAP:Lmnaflox/flox mice 2 weeks after Veh or Tam. Red boxes show magnified perinuclear space. Yellow and black arrowheads denote Golgi and 100 nm vesicles, respectively. m, mitochondria; n, nucleus. Scale bars, 1 μm. Numbers in line with EM micrographs denote percent abnormal nuclei quantified in Veh (n = 45 total nuclei) and 2 weeks after Tam (n = 31) from two independent hearts per group. (C) Immunoblot of lamin A/C, PERK, ATF4, and glyceraldehyde-3-phosphate dehydrogenase (GAPDH) in hearts from Veh or Tam-treated CM-CreTRAP:Lmnaflox/flox mice. Numbers on top denote individual hearts. One and 2 weeks denote time after final Tam treatment. Numbers in line with blots show quantification of protein bands normalized to GAPDH in arbitrary units. (D) qPCR analyses of mediators of unfolded protein response in hearts from CM-CreTRAP:Lmnaflox/flox mice treated with Veh or Tam. 1w, 2w, and 4w denote weeks after Tam. *P <0.05, **P <0.005, and #P <0.0001 using one-way ANOVA with Dunnett’s’s post hoc with Veh as control. n = 5 except for 1w (n = 3). All error bars in this figure = SEM. (E) Schema of experimental design using TRAP. Right panel shows qPCR on CM-specific translating mRNAs probed for Eif2ak3, Atf4, Ddit3, and Hspa5, respectively, from CM-CreTRAP:Lmnaflox/flox mice 1 to 4 weeks after Tam. *P < 0.05 and **P < 0.0005 using one-way ANOVA with Dunnett’s’s post hoc with Veh as control. n = 3.

