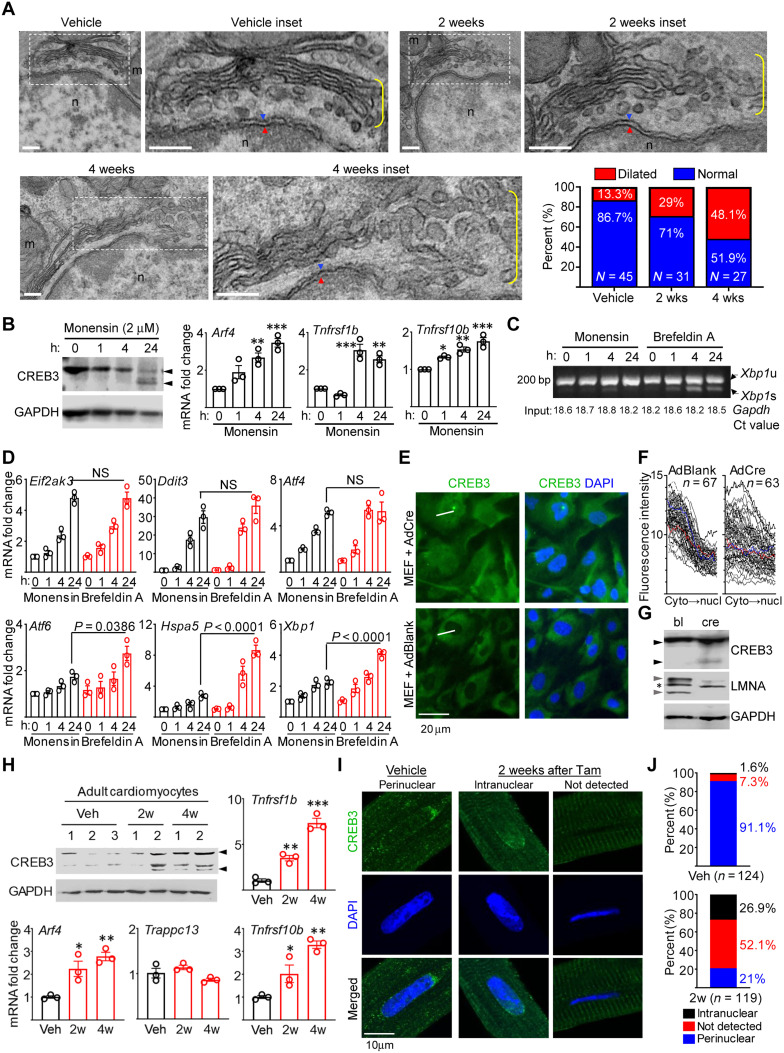
Fig. 4. Golgi stress in Lmna-deleted CMs.
(A) TEM of Lmna-deleted mouse hearts. Dotted boxes denotes inset. Yellow brackets denotes Golgi. Blue/red arrowheads denote outer/inner nuclear membranes. Scale bars, 200 nm. Quantitation of % dilated and normal Golgi in Veh (n = 45 nuclei), 2 weeks (n = 31), and 4 weeks (n = 27) after Tam. (B) CREB3/GAPDH immunoblots (left) and qPCR of CREB3-activated genes (right) in monensin-treated Lmnaflox/flox MEFs. Arrowheads denotes CREB3 cleavage. n = 3. (C) RT-PCR of Xbp1 mRNA splicing in monensin (2 μM)– or BFA (20 μM)–treated Lmnaflox/flox MEFs. Xbp1u and Xbp1s denote unspliced and spliced variants. Numbers on bottom denote Gapdh Ct values (input control). Representative image from three experiments are shown. (D) qPCR of UPR mediators in Lmnaflox/flox MEFs treated as in (C). n = 3. NS, not significant. (E) Representative CREB3 and DAPI images of AdBlank or AdCre-infected Lmnaflox/flox MEFs from three experiments. White lines denote linear fluorescence intensity measurement examples. Scale bar, 50 μm. (F) Fluorescence intensity profiles of CREB3 in AdBlank or AdCre-infected Lmnaflox/flox MEFs. Measurement directionality is from cytoplasm (cyto) to nucleus (nucl). (G) CREB3, LMNA, and GAPDH immunoblots in AdBlank (bl)– or AdCre (cre)–infected Lmnaflox/flox MEFs. Black and gray arrowheads denote CREB3 cleavage and lamin A/C, respectively. Asterisk denotes nonspecific band. Representative blot from n = 3 experiments. (H) Representative CREB3 and GAPDH immunoblot of adult CMs from Veh- or Tam-treated CM-CreTRAP:Lmnaflox/flox mice. n = 3 experiments. Numbers on top denote individual hearts. Arrowheads denote CREB3 and its fragments. Remaining graphs show qPCR on TRAP mRNA for Arf4, Trappc13, Tnfrsf1b, and Tnfrsf10b. n = 3 to 5. (I) Confocal CREB3 and DAPI images on adult CMs from Veh- or Tam-treated CM-CreTRAP:Lmnaflox/flox mice from three isolation per staining. Scale bar, 10 μm. (J) CREB3 quantification from (I). n = nuclei analyzed from three experiments. All error bars in this figure = SEM. All P = one-way ANOVA with Dunnett’s post hoc with *P < 0.05, **P < 0.005, and ***P < 0.0005.

