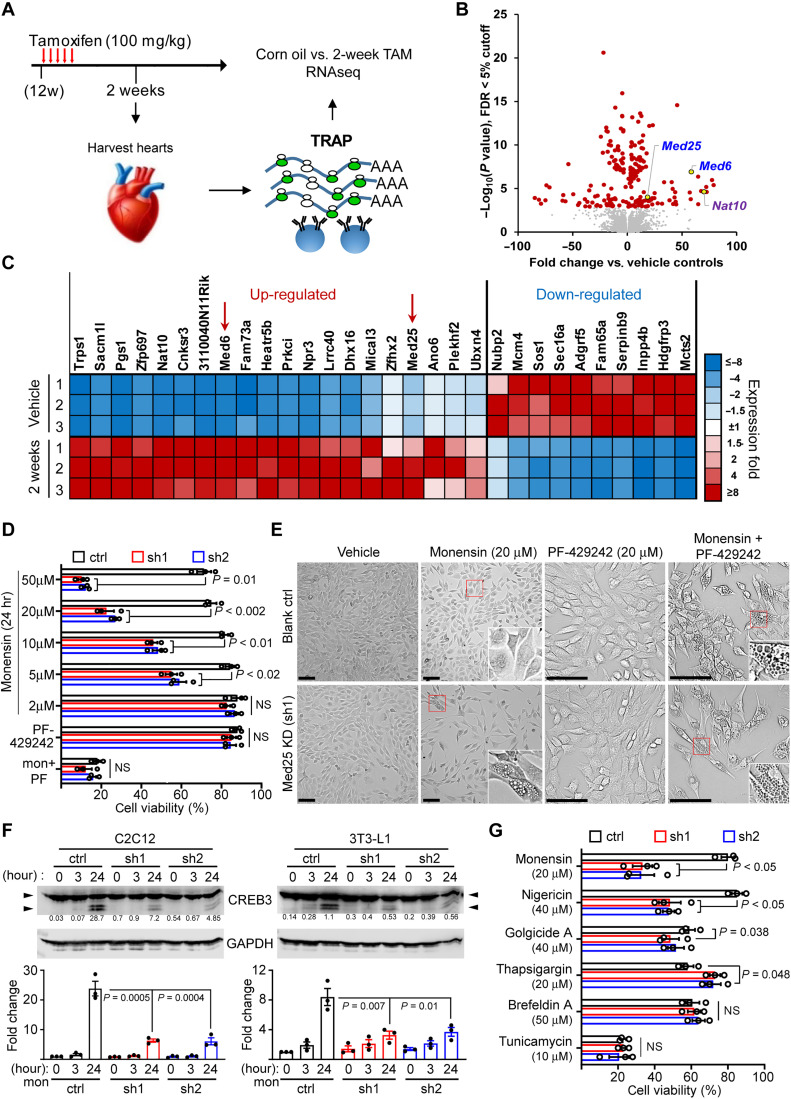
Fig. 5. MED25 depletion sensitizes cells to Golgi stress–induced vacuolar cell death.
(A) Experimental schema of TRAP/RNA-seq. (B) Volcano plot of differentially expressed genes sorted by –log10 of nominal P value with 5% FDR cutoff. (C) Heatmap of top 30 coding genes filtered by adjusted P values of perfect markers. Red arrows denote the position of Med6 and Med25. (D) Viability of MED25-depleted C2C12 treated with monensin, 20 μM PF-429242 (PF), and 20 μM PF-429242 + 2 μM monensin. The % cell viability was calculated relative to Veh controls. P values were calculated using two-way ANOVA with Dunnett’s correction. Error bars = SEM. n = 3 experiments. (E) Representative phase contrast images of blank control (ctrl) and MED25 KD C2C12 cells treated with Veh, monensin, PF-429242, and cotreatment. Insets, denoted by red boxes, show magnified cells with or without vacuoles. Scale bars, 50 μm. (F) CREB3 and GAPDH immunoblot of C2C12 (left) and 3T3-L1 (right) with MED25 KD (sh1 and sh2) treated with 2 μM monensin for 3 and 24 hours. Arrowheads denote CREB3 cleavage. Numbers in line with blots denote cleaved CREB3 quantitation normalized to GAPDH in arbitrary units. Bottom panels show cleaved CREB3 presented as fold change relative to ctrl at 0 hours (set to 1) from three experiments. P values were calculated using one-way ANOVA with Dunnett’s correction. (G) Viability of MED25-depleted C2C12 cells treated for 24 hours with chemical inducers of Golgi (monensin, nigericin, and golgicide A) and ER (BFA, thapsigargin, and tunicamycin) stress. The % cell viability was calculated relative to their respective cells treated with Veh. P values were calculated using two-way ANOVA with Dunnett’s correction. Error bars = SEM. n = 3. ns = not significant.

