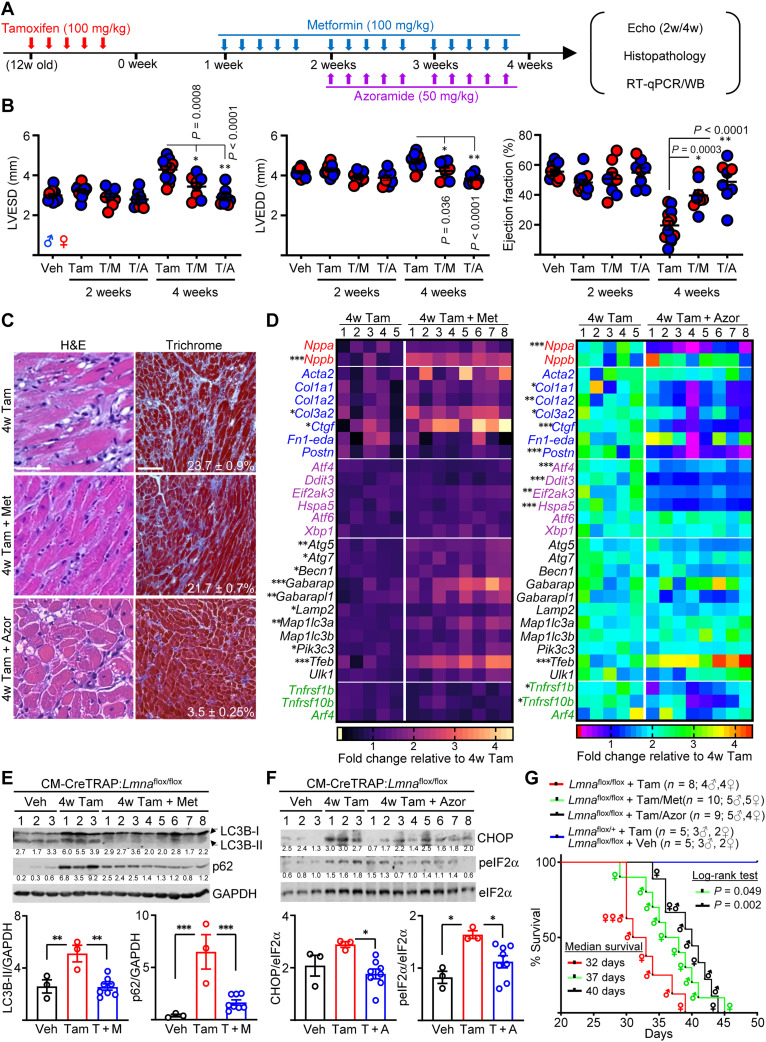
Fig. 7. Modulating autophagy or ER stress attenuates cardiomyopathy development.
(A) Schema of therapy schedule. (B) Echo on CM-CreTRAP:Lmnaflox/flox mice at 2 and 4 weeks after Tam, Tam + metformin (T/M), or Tam + azoramide (T/A). LVESD and LVEDD denote left ventricular end systolic and diastolic diameters, respectively. P values were obtained using one-way ANOVA with Tukey’s correction. Error bars = SEM. (C) Representative H&E and Masson’s Trichrome staining of heart sections from CM-CreTRAP:Lmnaflox/flox mice at 4 weeks after treatments described in (A) from three mice per group. Scale bars, 100 μm. (D) Heatmap of mRNA expression profile on natriuretic peptide precursors (red), profibrotic (blue), ER stress–related (purple), autophagy (black), and Golgi stress (green)–related genes in hearts from CM-CreTRAP:Lmnaflox/flox mice at 4 weeks after treatments described in (A). Numbers on top of heatmap denote biological replicates. Color gradient scales and values on bottom denote fold change over mean value of 4w Tam from the five biological replicates. P values were obtained using unpaired, two-tailed Student’s t test. *P < 0.05, **P < 0.01, and ***P < 0.001. (E) p62, LC3B, and GAPDH immunoblots on CM-CreTRAP:Lmnaflox/flox mice hearts at 4 weeks after Veh, Tam, and Tam + metformin. Numbers on top denote biological replicates. Numbers below blots denote band quantitation normalized to GAPDH in arbitrary units. Bottom shows compiled quantitation from biological replicates. P values were obtained using one-way ANOVA with Tukey’s correction. *P < 0.05, **P < 0.01, and ***P < 0.001. Error bars = SEM. (F) Immunoblot similar to above but with azoramide therapy and probed for CHOP, phospho-eIF2α (peIF2α), and eIF2α. (G) Kaplan-Meier plot of CreTRAP:Lmnaflox/flox mice treated with Tam (n = 8), Tam + metformin (n = 10), and Tam + azoramide (n = 9). Tam-treated CreTRAP:Lmnaflox/+ (n = 5) and Veh-treated CreTRAP:Lmnaflox/flox (n = 5) mice are presented as a single group. P values were calculated using log-rank test with the survival curve of CreTRAP:Lmnaflox/flox mice + Tam as the comparison control. Sex of mice at death is shown within the curve. WB, Western blot.

