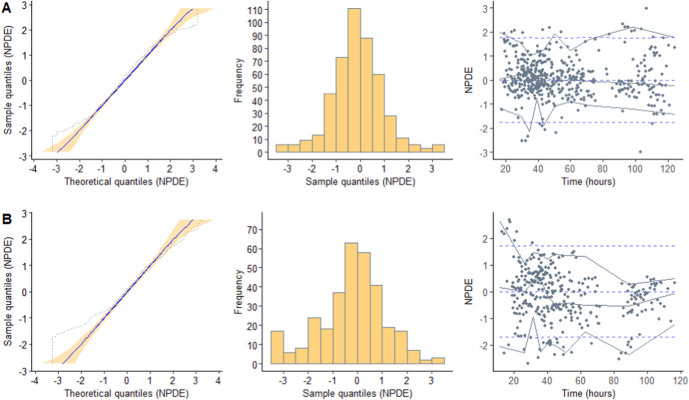
FIGURE 3.
Results obtained from the NPDE analysis, using (A) the model-building data set and (B) the external data set. The NPDE distribution displays a mean and variance of −0.0965 and 1.156, respectively, for the model-building data set, and −0.2087* and 1.726*, respectively, for the external data set (* indicates a statistically significant difference from 0 for mean and 1 for variance (P < 0.05) as determined by the Wilcoxon signed-rank test and Fisher test of variance). The TH period encompasses the hypothermic phase (0–72 hours), rewarming phase (72–96 hours), and normothermic phase (>96 hours).

