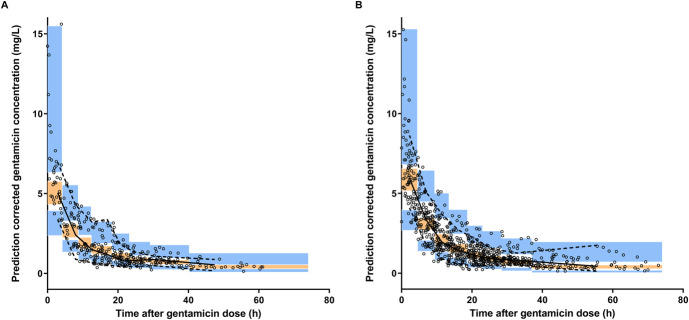
FIGURE 4.
Prediction-corrected visual predictive checks (pcVPC) for (A) the external data set using the previously published gentamicin model and (B) the merged data set, which includes both the model-building and external data sets. The black open circles represent observed gentamicin concentrations, while the black solid line denotes the observed median, and the black dashed lines depict the 5th and 95th percentiles. The orange area signifies the 95% CI of the model-predicted median, and the blue area indicates the model-predicted 5th and 95th percentiles.

