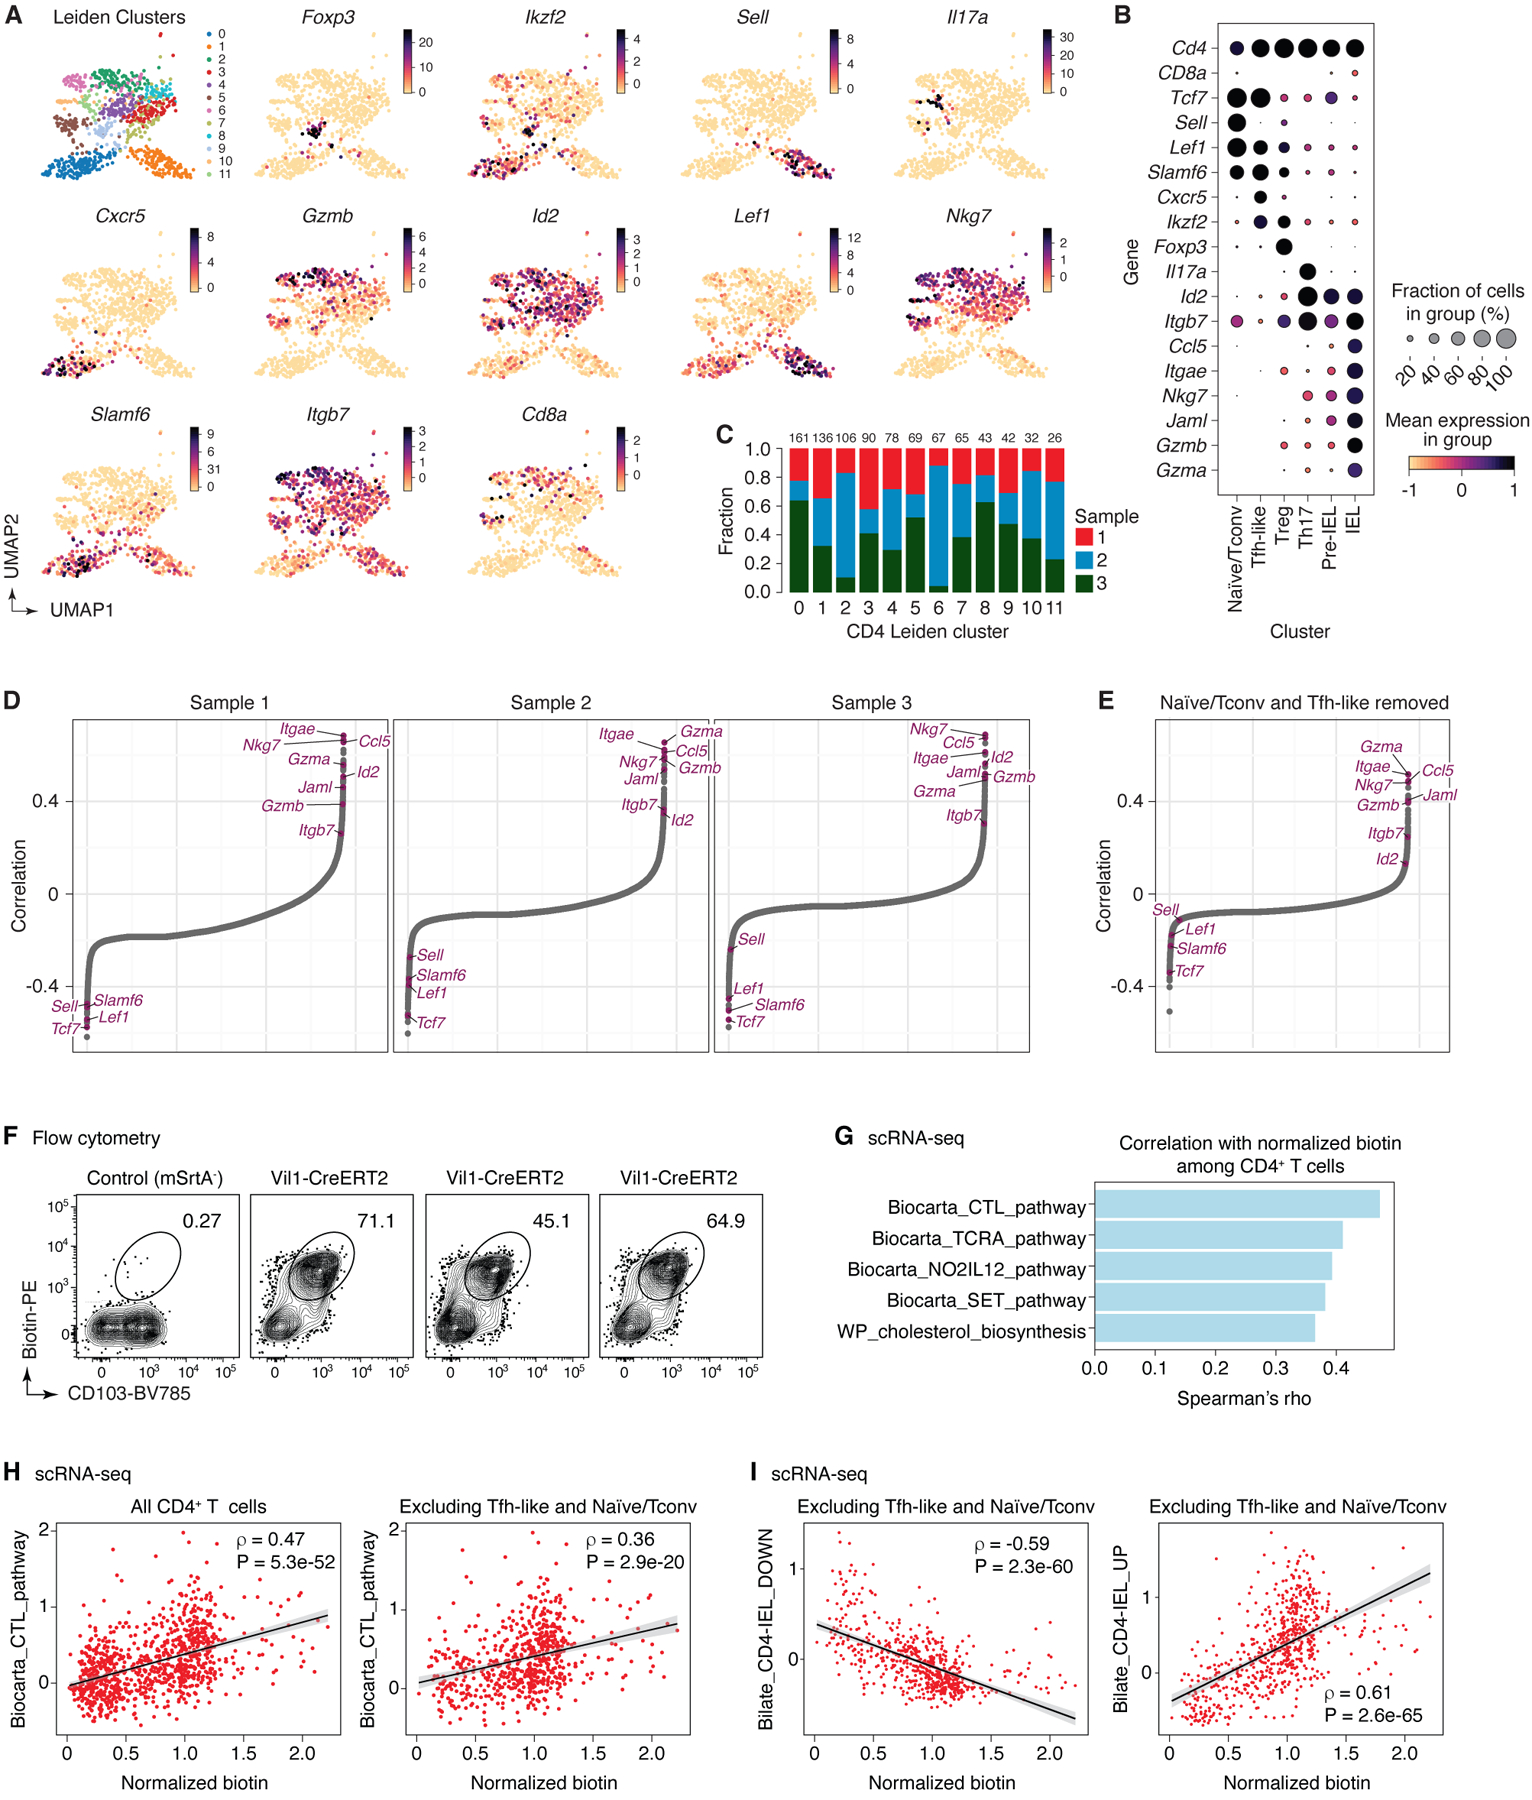
Extended Data Figure 8 |. Analysis of combined scRNA-seq + uLIPSTIC data for CD4+ T cells.

(A) UMAP for CD4+ T cells showing new Leiden sub-clusters and expression of selected marker genes in each cluster (n=915). (B) Dot plot of marker genes for each annotated subset of CD4+ T cells. Dot size indicates the fraction of cells in the cluster with Pearson residual normalized expression greater than 0, dot color represents level of expression. (C) Bar plot indicating CD4 Leiden cluster composition by biological replicate, cluster size indicated at the top of each bar. (D) Spearman correlation values, in increasing order, for uLIPSTIC signal and normalized expression of a gene, calculated separately for cells from each biological replicate, indicating consistency across mice. (E) Spearman correlation values, in increasing order, for uLIPSTIC signal and normalized expression of a gene, calculated when removing Tfh-like and naïve/conventional T cells (Leiden CD4 sub-clusters 0 and 1). (F-I) Correlation between acquisition of uLIPSTIC label and expression of CD103 and selected gene signatures by CD4-IELs. (F) Flow cytometry plots show uLIPSTIC signal and CD103 expression in one control Rosa26uLIPSTIC/WT and three Vil1-Cre.Rosa26uLIPSTIC/WT mice treated as in Fig. 3G. (G) Gene signatures from the MSigDB “canonical pathways” (M2.CP) database showing significant positive association with normalized biotin signal in scRNA-seq analysis over all CD4+ T cells. Plots show Spearman’s ρ value for each signature. (H) Correlation between acquisition of uLIPSTIC signal by CD4+ T cells (shown for all T cells and excluding Tfh-like and Naïve/Tconv clusters) and expression of the Biocarta CTL gene signature. Trend line and error are for linear regression with 95% confidence interval, Spearman’s ρ and two-sided P-value are listed. (I) Correlation between acquisition of uLIPSTIC signal by CD4+ T cells (shown for T cells excluding Tfh-like and Naïve/Tconv clusters) and expression of gene signatures up and downregulated as epithelial T cells transition from Tconv (CD4+CD103−CD8αα−) to CD4-IEL (CD4+CD103+CD8αα+) phenotypes (signatures based on data from Bilate et al.6). Trend line and error are for linear regression with 95% confidence interval, Spearman’s ρ and two-sided P-value are listed.
