
Extended Data Figure 9 |. Using uLIPSTIC to study CD8+ T cell priming during acute systemic LCMV infection.
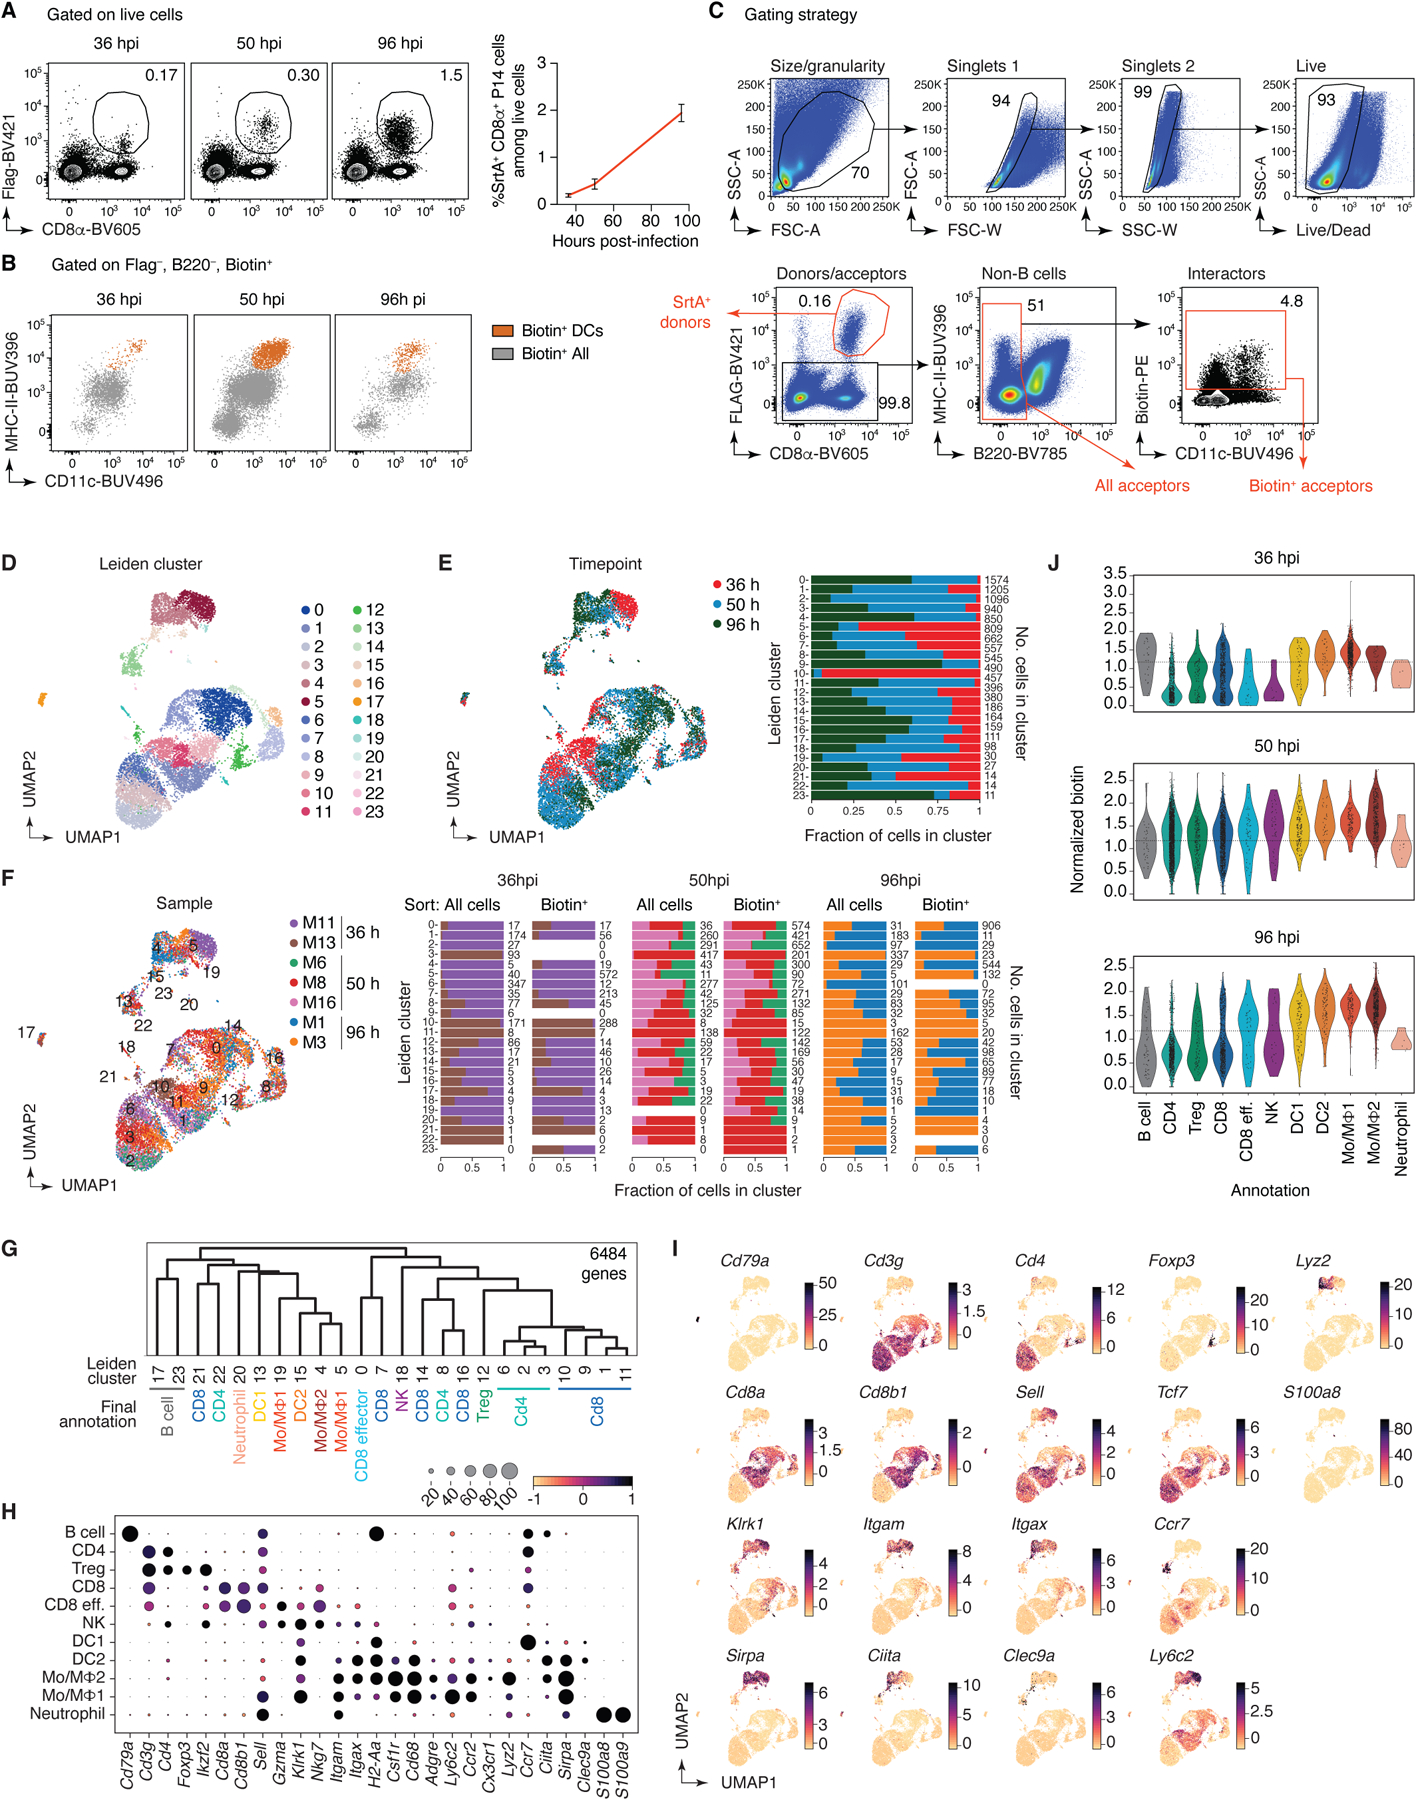
(A) Left, adoptively transferred LCMV-specific P14 CD8+ T cells infiltrated the mediastinal (m)LN of LCMV-infected Rosa26uLIPSTIC/uLIPSTIC hosts as early as 36 hpi. Right, fraction of P14 cells in total lymphocytes at the indicated timepoint. Data for ten mice per timepoint from three independent experiments, bar plots show mean ± SEM. (B) uLIPSTIC labeling of the P14-interactome (“Biotin+ All” in grey) showed that DCs (“Biotin+ DCs,” in orange) make up only a fraction of all interacting cells. (C) Sorting strategy for the scRNA-seq experiment. Immune cells—excluding B cells—were sorted both in an unbiased and biased manner, enriching for biotin+ acceptor cells and Flag+ donor cells using distinct hashtag oligos for downstream classification. Two-three independent samples per timepoint were sorted and stained with different hashtag oligos for downstream identification. (D-J) scRNA-seq nalysis of the immune interactome of P14 CD8+ T cells in the mLN during acute LCMV infection. (D) UMAP colored by Leiden clustering of the entire scRNA-seq/uLIPSTIC dataset (n=11,846 cells). (E) Left, UMAP colored by timepoint. Right, bar plot indicating cluster composition by timepoint, cluster size indicated at the right of each bar the right. (F) Left, UMAP colored by biological replicate. Right, bar plot indicating cluster composition by biological replicate, separated by whether the sample was sorted as total mLN cells or biotin-enriched mLN cells, as specified in (C). The cluster size is indicated at the right of each bar. (G) Dendrogram representing transcriptional similarities among clusters. Differentially expressed genes were identified for each cluster (log2FC > 1, FDR < 0.01, see Methods), and normalized expression of all such genes (6,484 genes total), averaged per cluster, was used for the hierarchical clustering analysis that produced the dendrogram. Final annotation clusters shown in Fig. 5 are indicated below the Leiden cluster numbers. (H) Dot plot of marker genes indicating their level of expression in each cell type annotation. Dot size indicates the fraction of cells in the cluster with Pearson residual normalized expression greater than 0, dot color represents level of expression. (I) UMAPs showing normalized gene expression levels for selected marker genes. (J) Violin plot showing levels of normalized uLIPSTIC signal for each cell type annotation, separated by timepoint and excluding P14 donor cells (high FLAG).