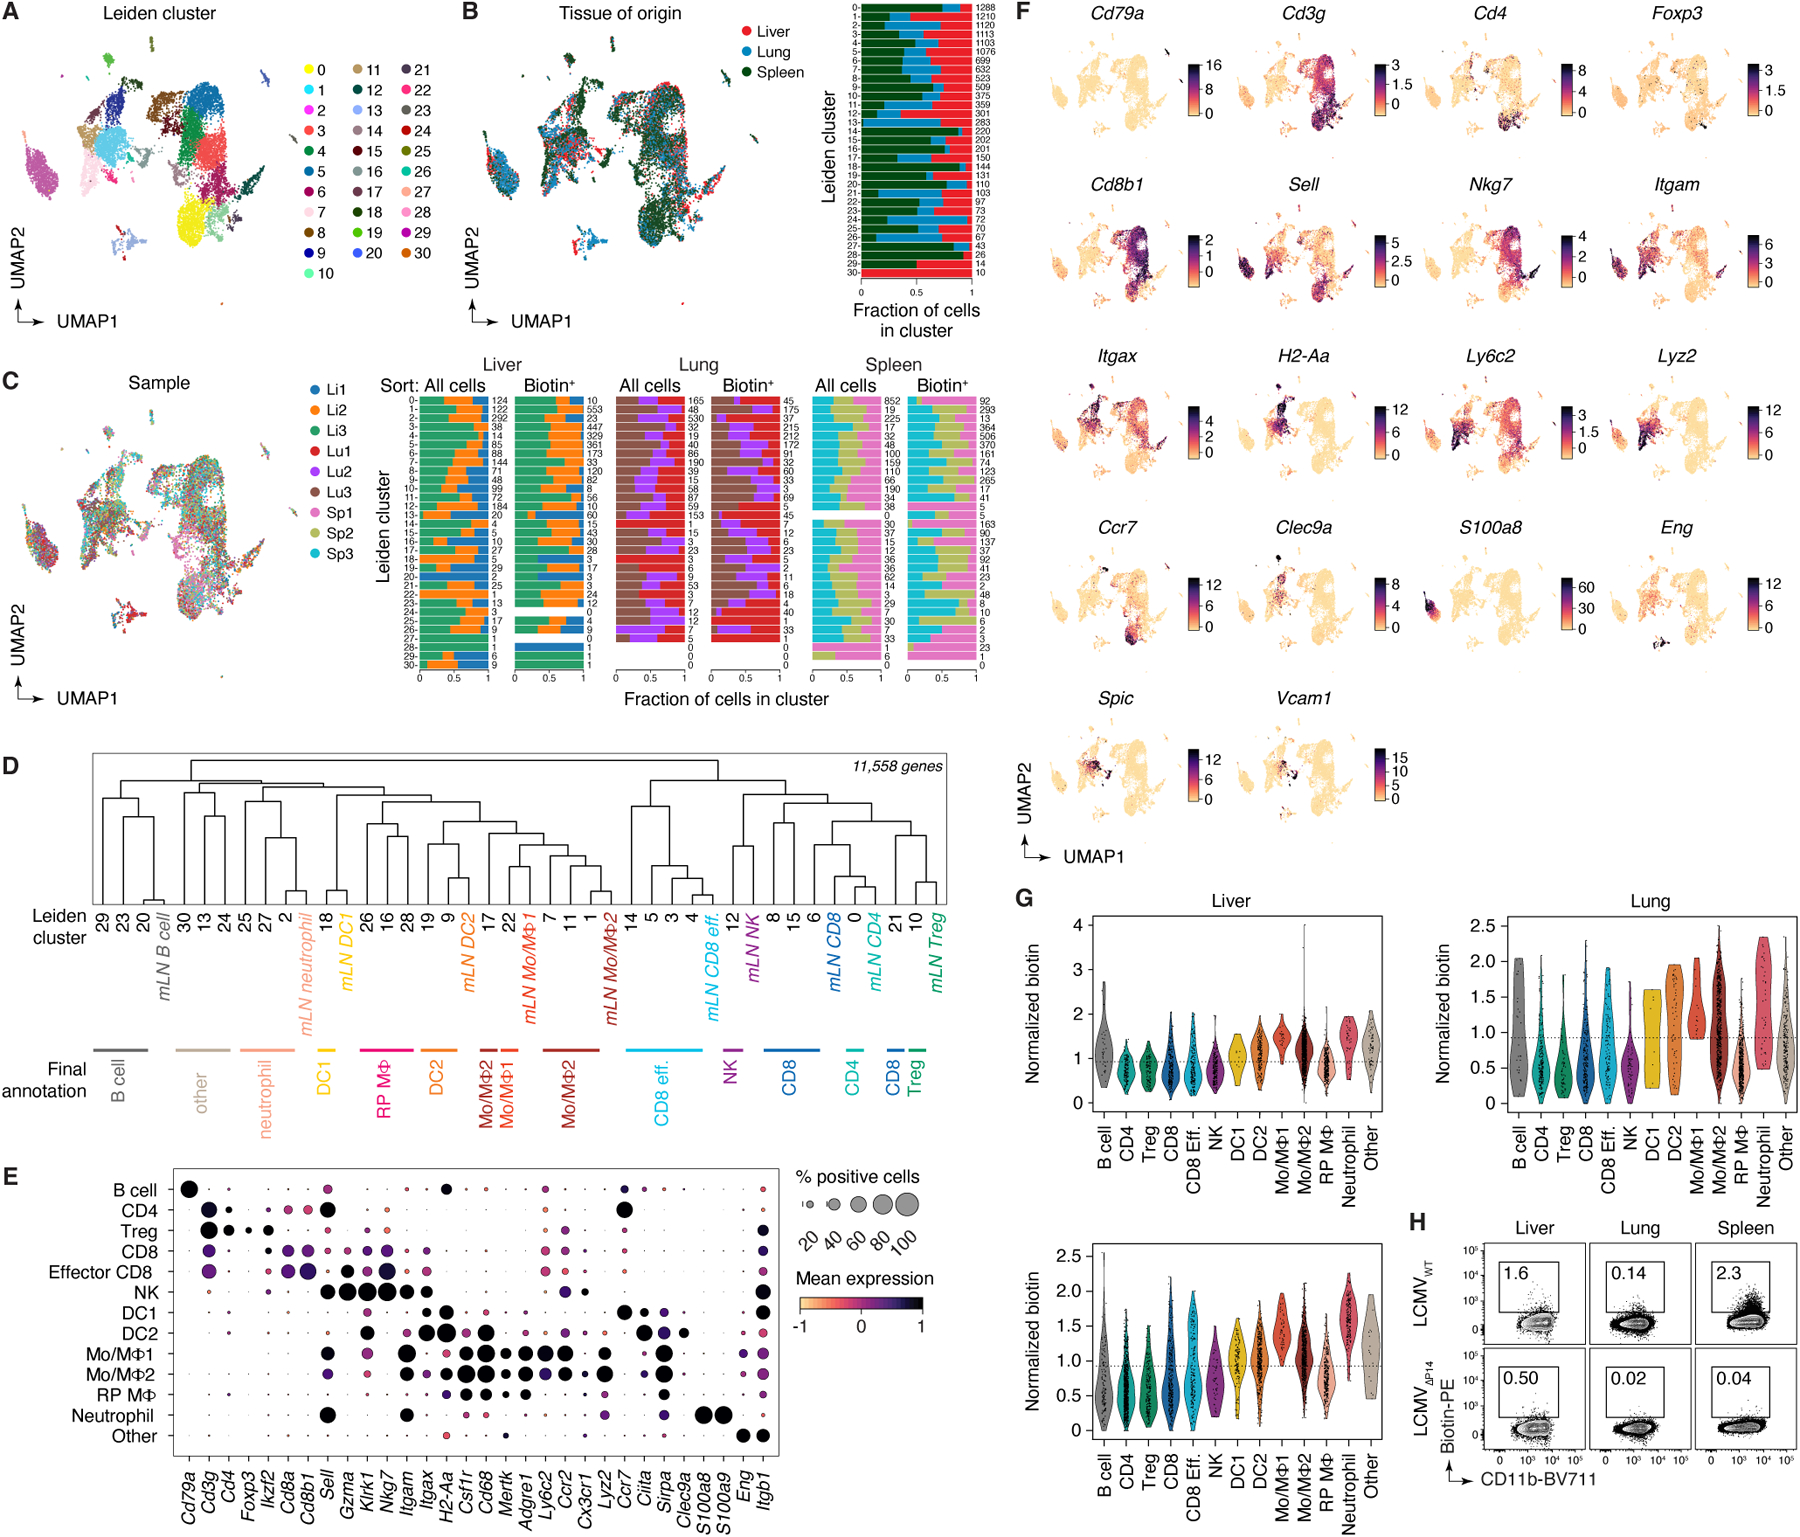
Extended Data Figure 10 |. Analysis of combined scRNA-seq + uLIPSTIC data for LCMV tissues (profiled at 96 hpi).

(A) UMAP colored by Leiden clustering of the entire scRNA-seq/uLIPSTIC dataset (n=12,324 cells). (B) Left, UMAP colored by tissue type. Right, bar plot indicating cluster composition by tissue, cluster size indicated at the right of each bar. (C) Left, UMAP colored by biological replicate. Right, bar plot indicating cluster composition by biological replicate, separated by whether the sample was unsorted cells or sorted as biotin-enriched cells. The cluster size is indicated at the right of each bar. (D) Dendrogram representing transcriptional similarities among tissue Leiden clusters with annotations from the mLN data. Normalized expression of all genes in the LCMV datasets (11,558 genes total), averaged per Leiden cluster for the tissue data and averaged per annotation for the mLN data, was used for the hierarchical clustering analysis that produced the dendrogram. Final annotation clusters shown in Fig. 5 are indicated below the Leiden cluster numbers. (E) Dot plot of marker genes indicating their level of expression in each cell type annotation. Dot size indicates the fraction of cells in the population with Pearson residual normalized expression greater than 0, dot color represents level of expression. (F) UMAP plots showing normalized gene expression levels for selected marker genes characteristic of the final annotation clusters. (G) Violin plot showing levels of normalized uLIPSTIC signal for each cell type annotation, separated by tissue type and excluding P14 donor cells (high FLAG). (H) uLIPSTIC labeling of MHC-IIhi monocytes/macrophages (Mo/MΦ2) in organs of mice treated as in Fig. 5A but infected with either LCMVWT or LCMVΔP14, analyzed at 96 hpi. Data from one experiment with each symbol representing one mouse, P-values were calculated using two-tailed Student’s test.
