
Figure 4 |. Using uLIPSTIC for interaction-based transcriptomics.
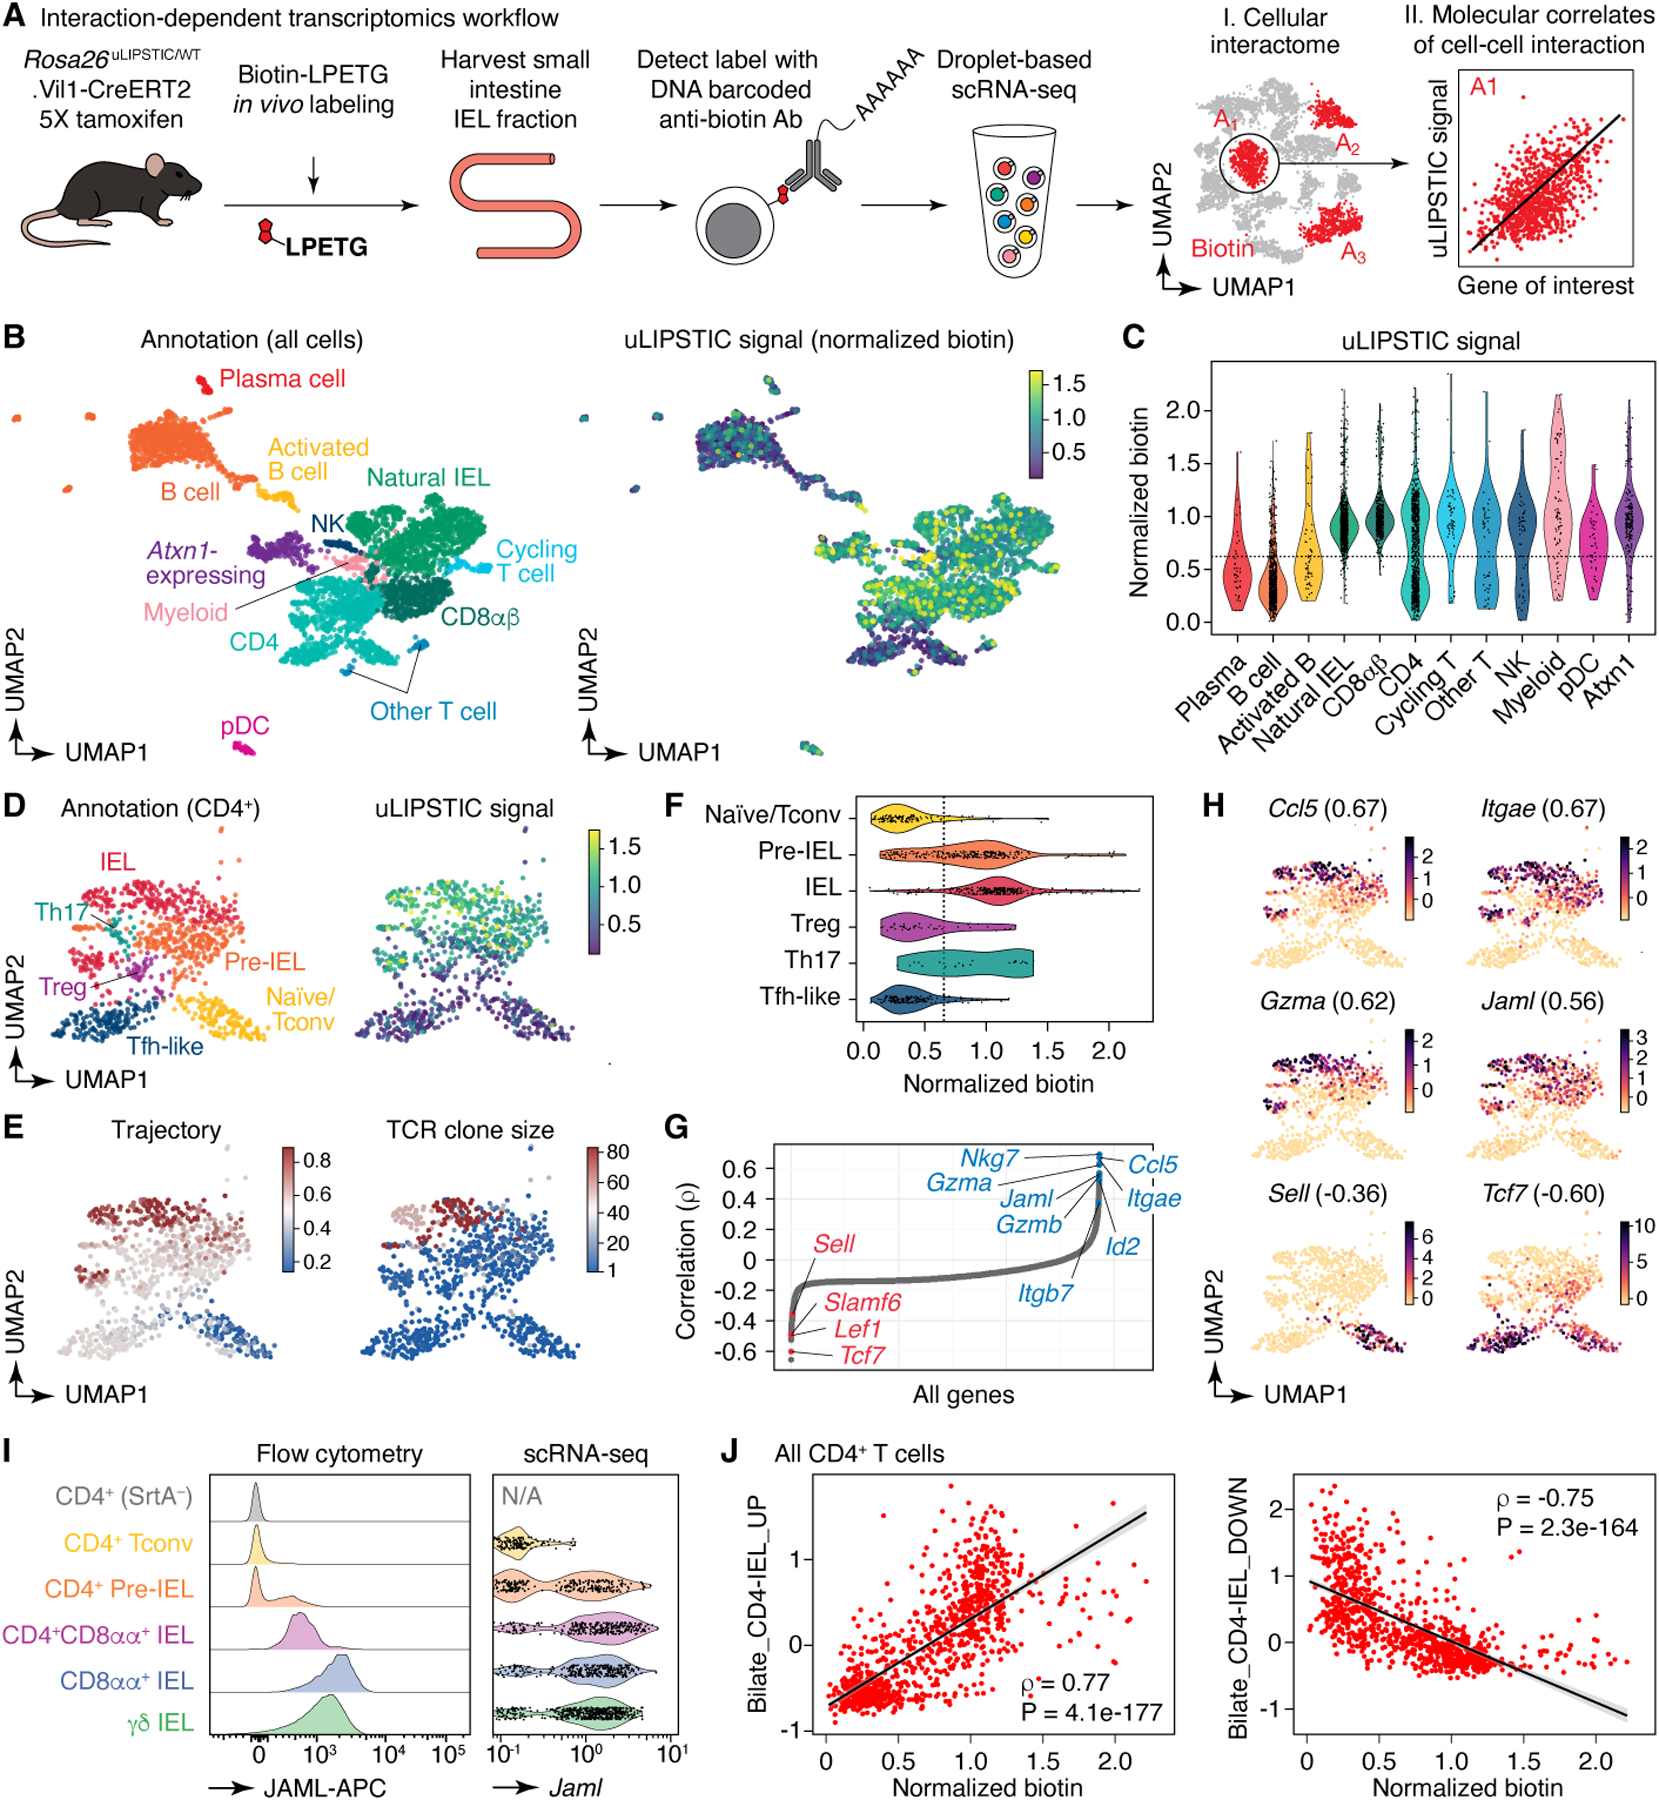
(A) Experimental workflow. (B) UMAP plots of the CD45+ intraepithelial immune cell fraction from a uLIPSTIC reaction as in Fig. 3G. Data pooled from three mice. Left, major cell populations (see Extended Data Figs. 6,7). Right, normalized uLIPSTIC signal in log-scaled arbitrary units. (C) Normalized uLIPSTIC signal among CD45+ cell populations. (D) UMAP plots of CD4+ T cells from (B), n=915 cells. Left, major cell subpopulations (see Extended Data Fig. 11). Right, normalized uLIPSTIC signal. (E) Left, inferred trajectory and right, αβTCR diversity (plotted as clone size) among CD4+ T cells. (F) Normalized uLIPSTIC signal among CD4+ T cell subpopulations. (G) Correlation (Spearman’s ρ) between normalized uLIPSTIC signal and normalized gene expression, calculated for each gene over all CD4+ T cells, shown in order of increasing correlation. Selected significantly correlated genes (FDR < 1e-23) are highlighted. (H) Normalized expression of selected genes. Correlation with normalized uLIPSTIC shown in parentheses. (I) Representative samples showing in vivo staining of JAML in IELs and scRNA-seq expression of Jaml in the equivalent populations. In the latter, CD8αα+ and γδ IEL were separated from within the “Natural IEL” cluster by the presence of rearranged αβ TCRs or expression of the Trdc gene. (J) Relationship between normalized uLIPSTIC signal among all CD4+ T cells and expression of gene signatures up and downregulated as epithelial T cells transition from Tconv (CD4+CD103−CD8αα−) to CD4-IEL (CD4+CD103+CD8αα+) phenotypes (signatures based on data from Bilate et al.6). Trend line and error are for linear regression with 95% confidence interval, Spearman’s ρ and two-sided P-value are listed.