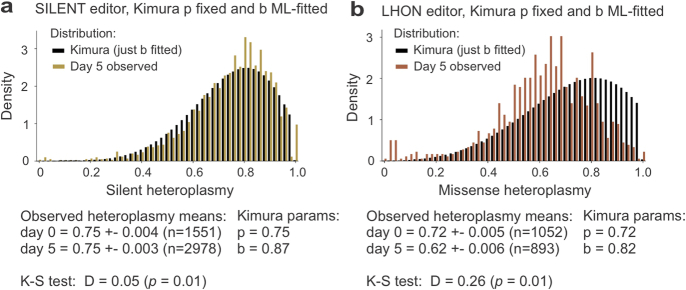
Extended Data Fig. 5. Kimura distribution fitting.
Density histograms showing the distribution of observed heteroplasmy in SILENT-edited (a) or LHON-edited (b) cells, and their corresponding maximum likelihood (ML) fits to the two-parameter Kimura(p,b) distribution after fixing the initial heteroplasmy parameter, p, to be equal to the experimentally-observed day 0 heteroplasmy. For the LHON-edited cells, the large shift in mean heteroplasmy between day 0 and day 5 cannot be accounted for by fitting only the Kimura drift parameter, b, and yields a poor fit (K-S D = 0.26) in contrast to the superior fit observed for the SILENT-edited cells (K-S D = 0.05).

