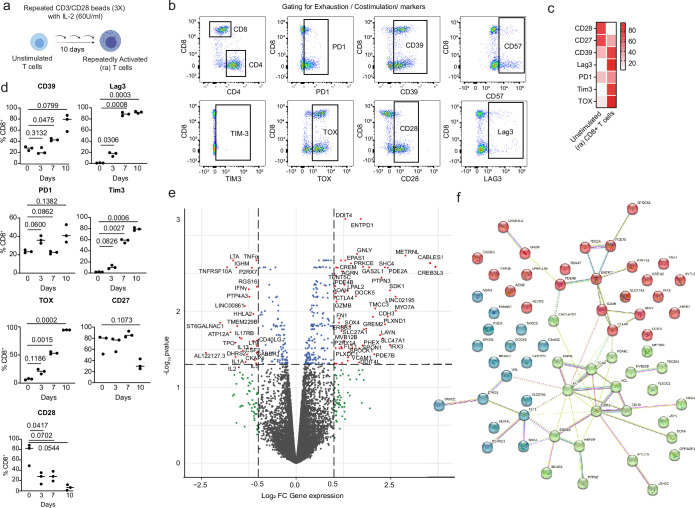
Extended Data Fig. 2. Characterization of repeatedly activated PBLs and PGE2-signature.
a, Schematic representation of the protocol for repeated activation of human peripheral blood lymphocytes using serial CD3/CD28 stimulation every 3 days in low dose IL-2 (Created with BioRender.com). b, Representative flow cytometry gates of exhaustion/costimulation markers used to characterize repeatedly activated PBLs. c, Heatmap representation of the frequency of inhibitory/co-stimulatory markers and TOX+ cells in unstimulated and repeatedly activated CD8+ T cells on day 10. d, Time-course evaluation of inhibitory markers (CD39, Lag3, PD1, TIM3), exhaustion marker TOX and co-stimulatory molecules (CD27, CD28) expression on CD8+ T cells during the repeated activation protocol at day 0-3-7-10. Data are represented as median of 3 biological replicates. Statistical comparisons were performed using one-way ANOVA with Dunnett post-hoc test for multiple comparisons. e, Volcano plot of differentially expressed (DE) genes in repeatedly activated CD8+ T cells treated with PGE2 for 24 h. The Y-axis represents log10 p-values, whereas the X-axis represents log2 fold change in gene expression. Two-sided paired t test with Benjamini Hochberg correction. f, String analysis of the 63 top upregulated genes (p < 0.05, FC > 1) in repeatedly activated CD8+ T cells after PGE2 treatment (PGE2 signature). N = 3 independent biological samples.

