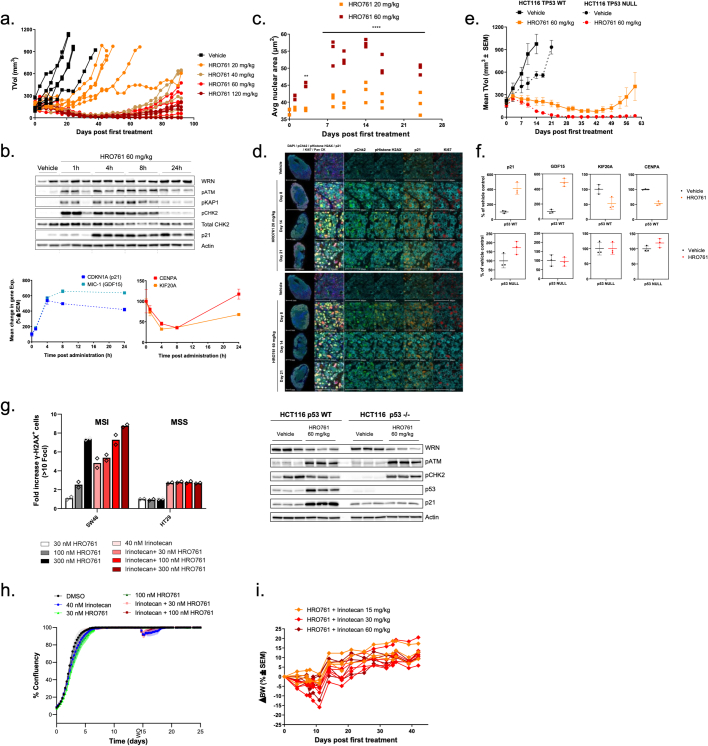
Extended Data Fig. 8. In vivo responses to HRO761 in p53 WT and null cells alone or in combination.
a. Individual SW48 tumour volume data from Fig 4a. b. Immunoblot for WRN, pATM (S1981), pCHK2 (T68), total CHK2, phospho-KAP1 (S824), p21 and actin from SW48-tumour bearing mice (n = 3) treated at 60 mg/kg and sacrificed/sampled at 1, 4, 8 and 24 h post-treatment. Bottom panel p21, GDF15, CENPA and KIF20A mRNA levels were quantified by qRT-PCR. c. Average nuclear area measured in SW48 tumour sections. ** P < 0.01 and **** P < 0.0001, 2-way ANOVA with a Sidak’s multiple comparison test. d. DNA damage response after HRO761 treatment was evaluated on SW48 xenograft FFPE sections by Multiplex Immunofluorescence: DAPI (blue), pCHK2 (green), γH2AX (yellow), p21 (orange), Ki67 (red) and PAN CK (pale blue). e. Tumour xenograft growth in HCT116 TP53 WT or null models treated with HRO761 at 60 mg/kg (n = 6 mice per group). f. Top. qRT-PCR for p21, GDF15, CENPA and KIF20A. Data are mean of expression compared to vehicle control ± SD, n = 3 mice. Bottom. Immunoblot for WRN, pATM (S1981), pCHK2 (T68), total CHK2, pKAP1 (S824), p21 and actin from HCT116-tumour bearing mice (n = 3) treated at 60 mg/kg of HRO761 and sacrificed 4 h post second treatment. g. DNA damage accumulation after HRO761 treatment as SA and in combination with Irinotecan was evaluated by quantification of γH2AX foci formation on SW48 (MSI) and HT29 (MSS) cells. Bars represent the mean of 2 values and is a representative experiment (n = 2). h. Incucyte confluence plots from Cal33 cells treated with HRO761 and irinotecan at indicated concentrations. Graph is a representative experiment (n = 3). i. Body weight (BW) change (%) from the mice treated with the combination of HRO761 at 20 mg/kg and irinotecan doses from 60 to 15 mg/kg (efficacy in Fig. 4g).

