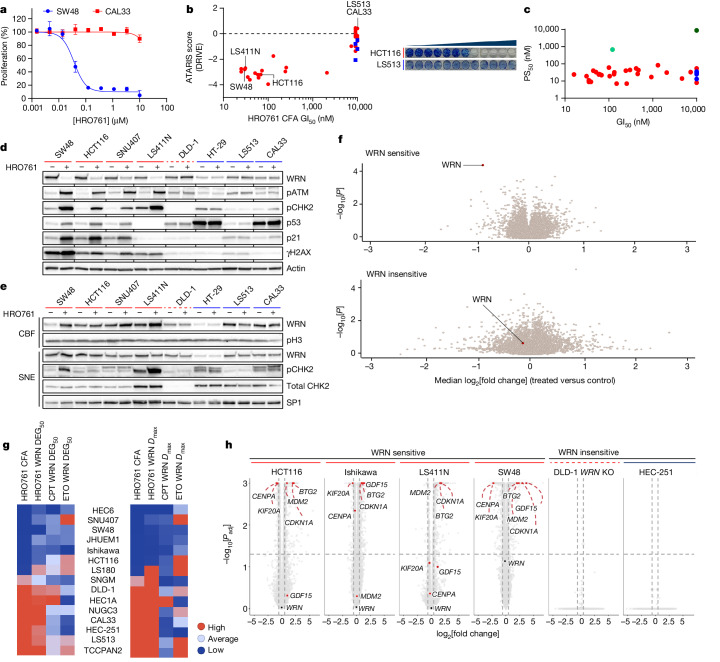
Fig. 2. WRN inhibitors recapitulate synthetic lethality in MSI but not MSS cells and lead to DNA trapping.
a, Representative survival curve of SW48 (MSI) and CAL33 (MSS) cells exposed to HRO761 for 4 days (CellTiter-Glo). Data are the mean ± s.d. percentage change compared with the DMSO control group. n = 3. b, The colony-formation assay (CFA) GI50 for HRO761 treatment in MSI (red, n = 20) and MSS (blue, n = 8) cells versus the ATARIS WRN dependency score (DRIVE). Right, representative CFA images of HTC116 and LS513 cells after 10 days. c, PS50 versus GI50 for HRO761 treatment in MSI (red) and MSS (blue) cells in the CellTiter-Glo assay. HCT116 and RKO cells with a C727A or C727S knock-in mutation at the WRN gene are shown in light and dark green, respectively. n = 28 (MSI) and n = 5 (MSS). d, Immunoblot analysis of WRN, phosphorylated ATM (pATM; Ser1981), pCHK2 (Thr68), p53, p21, γH2AX and actin after treatment with HRO761 for 24 h (WRN) or 8 h (other markers). e, Immunoblot analysis of the chromatin-bound fraction (CBF) and soluble nuclear extracts (SNE) of MSI and MSS cells treated with HRO761 at 10 µM for 1 h. f, Volcano plot showing P values (paired t-tests) plotted against median log2[fold change] of protein levels of three MSI cells (top) and one MSS cell (bottom) after treatment with compound 3 for 24 h (n = 2). g, The sensitivity to HRO761 was determined using a CFA, and WRN degradation was analysed after treatment with HRO761, camptothecin (CPT) or etoposide (ETO) in 15 cell lines. The compound concentration needed to achieve 50% WRN degradation (DEG50; left) and maximal degradation (Dmax; right) are shown. h, Differentially expressed genes in bulk RNA-seq data from cells treated with compound 2 (cases) compared with untreated cells (controls). Statistical significance was determined using two-sided Wald tests (in DEseq2), followed by Benjamini–Hochberg multiple-testing correction (n = 3). Padj, adjusted P.

