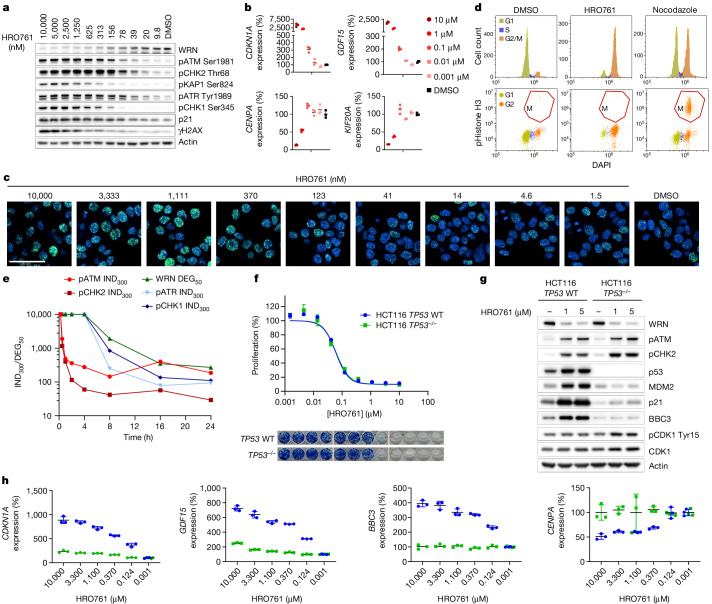
Fig. 3. WRN inhibition leads to cell cycle arrest and DNA damage in a time- and dose-dependent manner, independently of p53.
a, Immunoblot analysis of WRN, pATM (Ser1981), pCHK2 (Thr68), pKAP1 (Ser824), pATR (Tyr1989), pCHK1 (Ser345), p21, γH2AX and actin in HCT116 cells after 24 h of treatment with HRO761 at the concentration indicated at the top. b, CDKN1A (encoding p21), GDF15, CENPA and KIF20A mRNA levels were quantified by quantitative PCR with reverse transcription (RT–qPCR) in HCT116 cells treated with HRO761 as described. Data are mean ± s.d. percentage expression compared with the DMSO treatment group. n = 3. c,d, γH2AX immunofluorescence (c) and cell cycle analysis (d) in HCT116 cells after treatment with either DMSO or HRO761 at 10 µM for 24 h. Cell cycle analysis showing DAPI staining (top) and DAPI against phosphorylated histone H3 (bottom). Immunofluorescence data are from one representative experiment out of three. Scale bar, 50 µm. e, Time course of PD modulation quantified as the amount of HRO761 required to induce 300% phosphorylation (IND300) of DDR markers or 50% WRN degradation compared with DMSO. Western blot images are shown in Extended Data Fig. 5. f, Survival curves of HCT116 TP53 wild-type (WT) or HCT116 TP53−/− cells exposed to HRO761 for 5 days (top). The cell viability was estimated using the CellTiter-Glo assay. Data are mean ± s.d. percentage of surviving cells compared with DMSO treatment. n = 3 biological replicates. Bottom, representative image of a 14 day CFA. g,h, Immunoblot analysis of WRN, pATM (Ser1981), pCHK2 (Thr68), p53, MDM2, p21, BBC3, pCDK1 (Tyr15), CDK1 and actin (g) and RT–qPCR analysis of CDKN1A, GDF15, BBC3 and CENPA (h) in HCT116 TP53 WT (blue) or HCT116 TP53−/− (green) cells exposed to HRO761 for 24 h. Data are mean ± s.d. percentage expression compared with the DMSO treatment group. n = 3 biological replicates.

