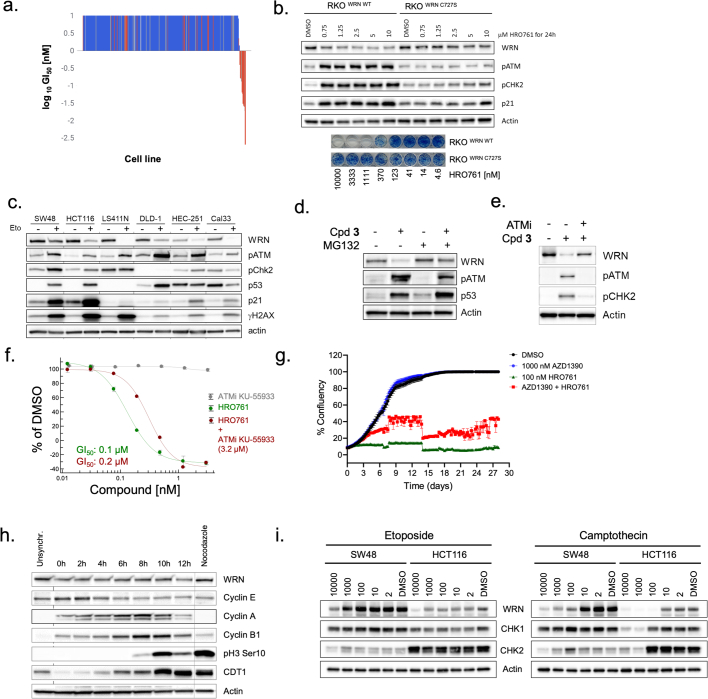
Extended Data Fig. 3. WRN degradation is proteasome and DNA damage mediated.
a. Waterfall plot bar graph display of GI50 values of the 301 Horizon OncoSignature cell line panel. Cells were exposed to HRO761 for 120 h. MSI: red, MSS: blue. b. Immunoblot for WRN, pATM (S1981), pCHK2 (T68), p21 and actin of RKO parental and RKO WRN C727S knock-in cells after treatment of HRO761 for 24 h. Bottom. Representative image of a 15-day CFA of the same cells treated with HRO761. c. Immunoblot for WRN, pATM (S1981), pCHK2 (T68), p53, p21, γH2AX and actin after treatment with etoposide for 24 h. d. Immunoblot for WRN, pATM (S1981), p53 and actin from HCT116 cells treated with compound 3 at 10 µM for 24 h with or without proteasome inhibitor MG132 at 1 µM for 24 h. e. Immunoblot for WRN, pATM (S1981), pCHK2 (T68) and actin after treatment with co-treatment with 1 µM 3 and 1 µM KU-55933 (ATMi) for 24 h in HCT116 cells. f. Survival curves of SW48 cells treated with 96 h with the indicated concentrations of HRO761 (green) and ATMi KU-55933 (grey) alone or the combination of HRO761 dose response with 3.2 µM of KU-55933. Data represent mean ± SD, n = 3 g. Incucyte generated confluence plot from SW48 cells exposed to a combination of HRO761 and ATMi AZD1390 at the indicated concentrations. Data represent mean ± SD, n = 2. Graphs from f and g are from a representative experiment (n = 3). h. Immunoblot after double thymidine block and release of HCT116 cells harvested at the indicated timepoints after release as described in the methods section. Cells were treated with 330 nM nocodazole for 18 h as a control. i. Immunoblot of SW48 and HCT116 cells treated with etoposide or camptothecin at the indicated concentrations (nM) for 24 h.

