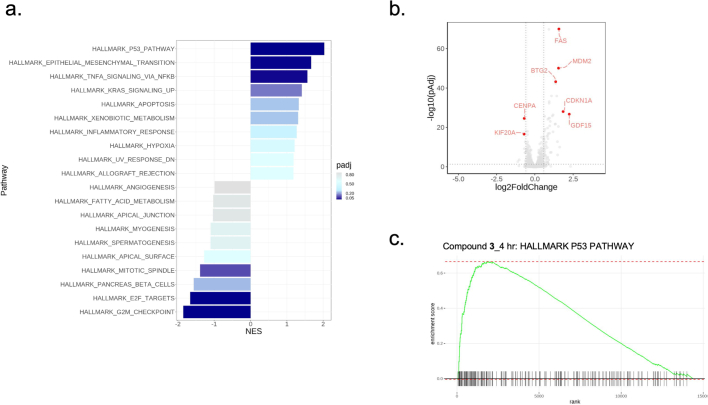
Extended Data Fig. 4. WRN inhibition induces apoptosis, a p53 response and cell cycle arrest.
a. Results of GSEA Hallmark analysis showing the enriched gene sets from bulk RNASeq analysis of SW48 tumours from mice treated once with 3 at 150 mg/kg and sacrificed/sampled 4 h post treatment. Listed are the top 10 positively and negatively enriched gene sets based on normalized enrichment scores (NES), coloured by statistical significance. Gene sets p-values were calculated using an adaptive, multilevel splitting Monte Carlo approach implemented in the fsgea R package and adjusted for multiple hypothesis testing by the Benjamini–Hochberg method (pAdj). b. P values (pAdj) plotted against log2 fold change of expression from bulk RNASeq analysis of tumours from mice treated once at 150 mg/kg and sacrificed/sampled 4 h post treatment. Statistical significance was determined using a two-sided Wald test statistical analysis (in DEseq2), followed by Benjamini-Hochberg multiple-correction testing (n = 5 mice). c. Signature enrichment plot for p53 hallmark gene set.

