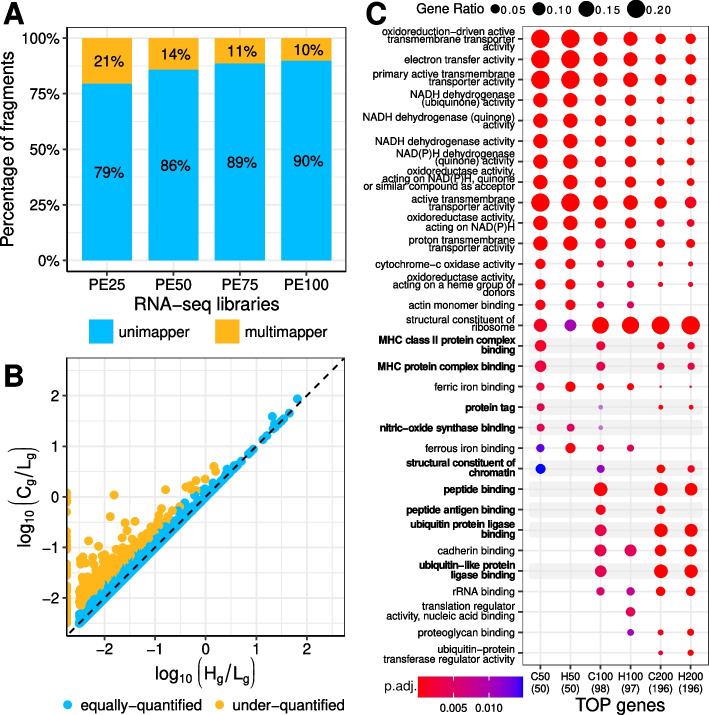
Fig. 2.
Discarding multimappers leads to functional mischaracterization of repetitive gene families. A Percentage of uni- and multimapper fragments mapping to human genome for a RNA-seq library of dataset 3 generated by the ENCODE consortium using pair-end 100 bp (“PE100”) and thereof simulated libraries with read pairs of length 25, 50 and 75 bp (“PE25”, “PE50” and “PE75”, respectively). Within the read lengths assessed, the difference in the proportion of multimappers was modest (10–21%). B Scatter plot showing gene expression values computed with HTSeq-count using default parameters (“–nonunique none”; x-axis) and by our “multimapper-aware” strategy (y-axis) for PE100. Each dot represents a protein-coding gene and is coloured differently depending on whether it is considered (approximately) equally-quantified or under-quantified by HTSeq-count (see Methods). The dashed line indicates identical gene expression values. About 6% (777 out of 13,437) expressed genes are under-quantified when discarding multimappers. C Gene ontology (GO) enrichment analysis of the 50, 100, and 200 protein-coding genes with the highest expression values in PE100 as computed by HTSeq-count (“H50”, “H100”, and “H200”, respectively) or our “multimapper-aware” strategy (“C50”, “C100”, and “C200”, respectively). GO enrichment analysis was performed for the “molecular function” category and using the “org.Hs.eg.db” annotation for the human genome. The q-value threshold was set to 0.01. Dot size represents the ratio between the number of genes in the given GO term (y-axis) and the number of genes annotated in each category (shown in brackets, below the label of each gene set on the x-axis). Dot colour indicates the P-value adjusted by Benjamini-Hochberg (BH, “p.adj.”). Neglecting multimappers leads to the underrepresentation of genes associated with specific GO terms (indicated in bold and with grey shading)

