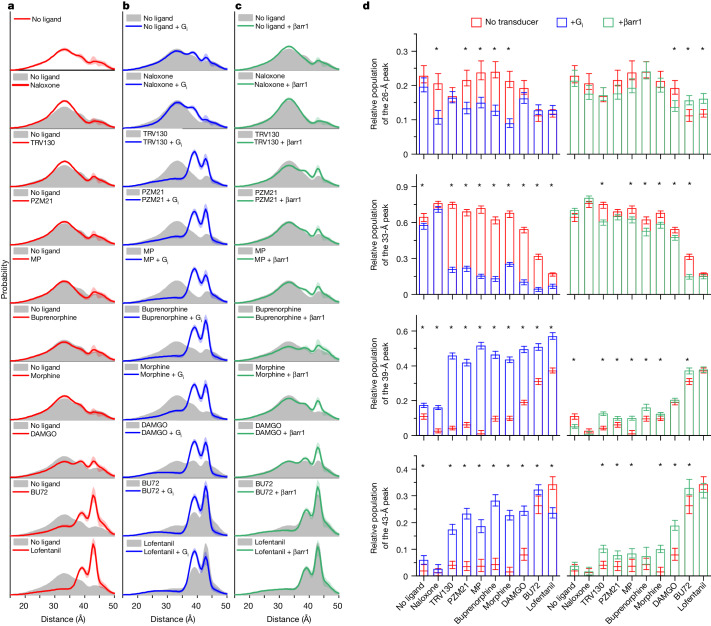
Fig. 2. Ligand- and transducer-dependent µOR conformational heterogeneity characterized by DEER.
a, Distance distributions of spin-labelled µOR under different ligand conditions. b, Distance distributions in the presence of ligand and Gi. c, Distance distributions of phosphorylated µOR (µORp) in the presence of ligand and pre-activated β-arrestin-1 (βarr1). a–c, Shaded areas along the line indicate 95% confidence interval. d, Gaussian populations centred around 26 Å, 33 Å, 39 Å and 43 Å. Data represent median population ± 95% confidence interval derived from bootstrapping analysis using n = 1,000 iterations. Populations marked with asterisks have non-overlapping confidence intervals in the presence and absence of transducer.

