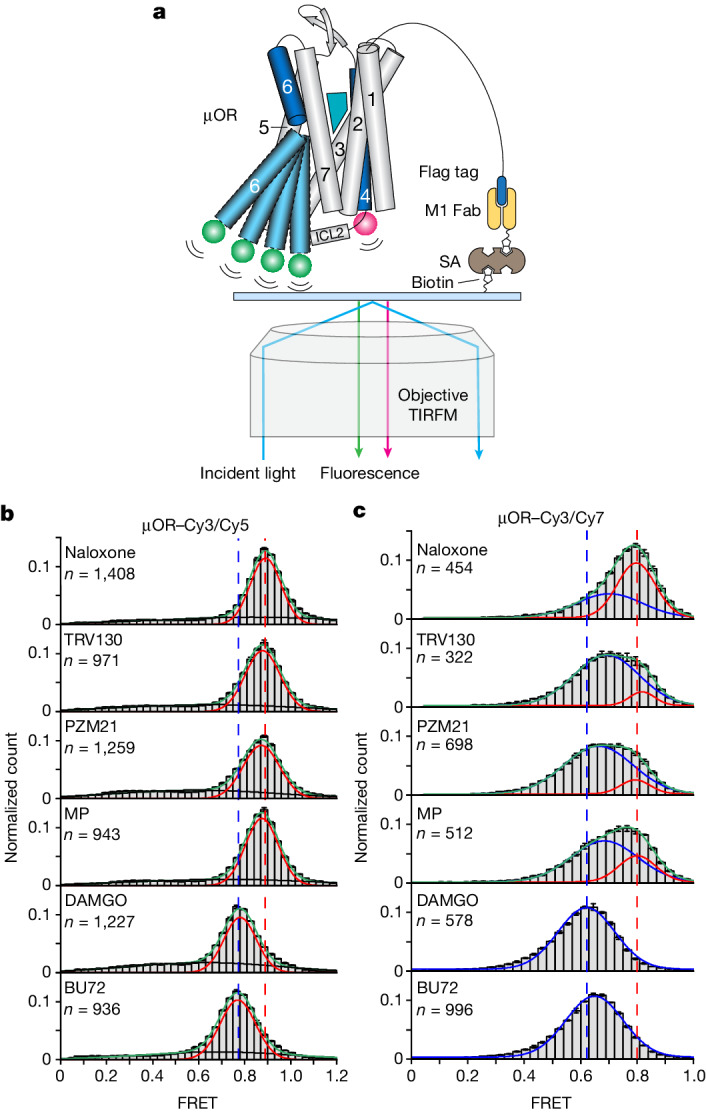
Fig. 3. SmFRET experiments of the µOR bound to different ligands.

a, Schematic of single-molecule FRET experiment. Labelled µOR was tethered to a cover slip via its Flag tag, biotinylated M1 Fab, streptavidin (SA) and biotinylated PEG. TIRFM, total internal reflection fluorescence microscopy. b,c, SmFRET distributions of µOR–Cy3/Cy5 (b) and µOR–Cy3/Cy7 (c) in the presence of different ligands. Gaussian peaks were fitted to FRET states (red and blue) and background noise (black). Green lines represent the cumulative fitted distributions. Dashed lines in blue and red represent peak centres of naloxone- and DAMGO-bound samples, respectively (n represents the number of fluorescence traces used to calculate the corresponding histograms). Data are mean ± s.d. from three repeats.
