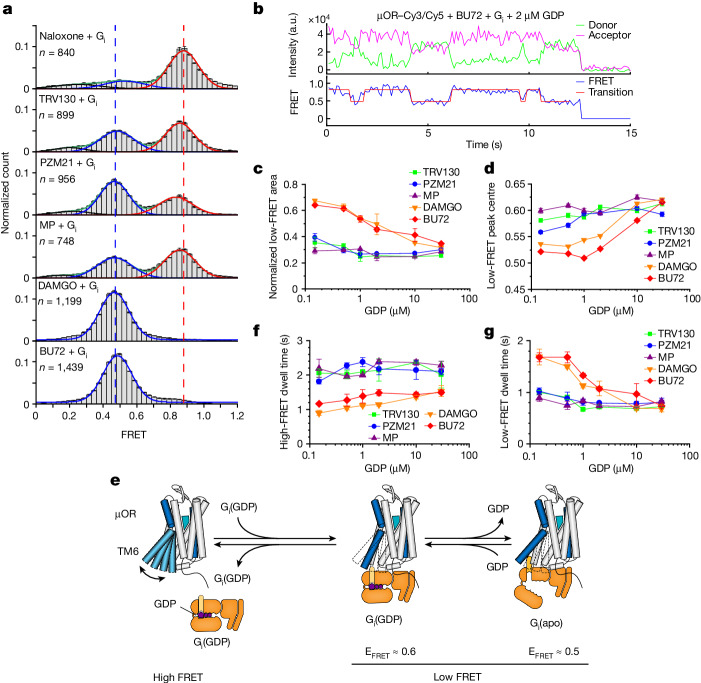
Fig. 4. Structural dynamics of the µOR in the presence of Gi and GDP.
a, smFRET distributions of µOR–Cy3/Cy5 in the presence of different ligands and Gi, followed by treatment of apyrase to remove GDP. Red, blue and black lines represent Gaussians fitted to high-FRET, low-FRET and nonfunctional states, respectively. Green lines represent the cumulative fitted distributions. Dashed lines indicate high-FRET peak centre of naloxone sample (red) and low-FRET peak centre of the BU72 sample (blue), respectively. n represents the number of fluorescence traces used to calculate the corresponding histograms. Data are mean ± s.e.m. from three repeats. b, Exemplary smFRET traces of µOR–Cy3/Cy5 and analysis via a two-state hidden Markov model. a.u., arbitrary units. c, Area of the low-FRET peak at increasing GDP concentrations. Data are mean ± s.d. from two biological repeats. d, Low-FRET peak position with increasing GDP concentrations. Frames of low-FRET state identified by a two-state hidden Markov Model were extracted and binned to plot histograms. FRET histograms were further fitted to Gaussians and the peak centres are plotted. Error bars represent the standard error of fitting. e, Schematic of a simplified reaction model of G-protein coupling. f, Dwell time of the high-FRET state. g, Dwell time of the low-FRET state. f,g, Data are mean ± s.d. from two biological repeats.

