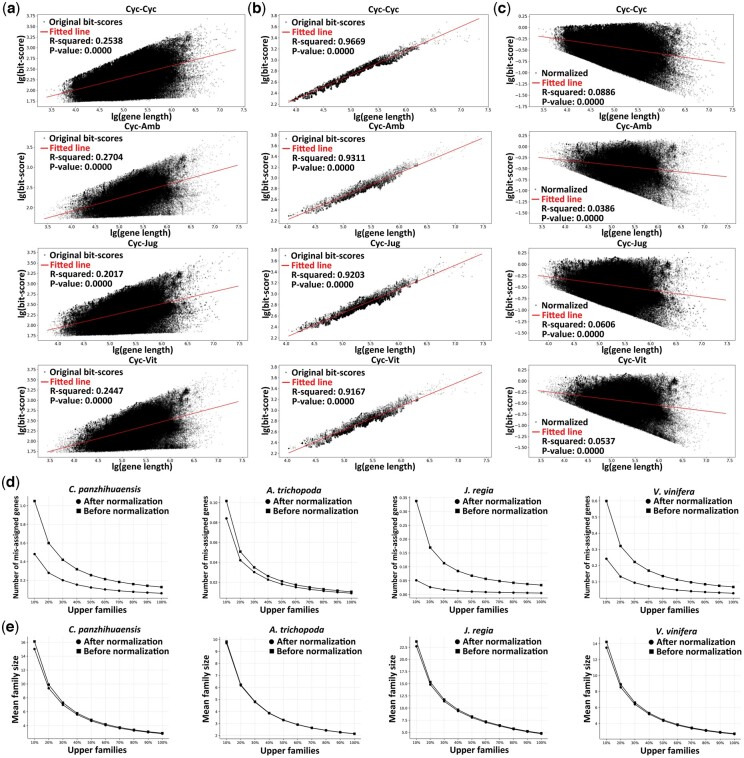
Figure 1.
Gene length bias and the effect of normalization on whole-paranome inference. Cyc, Amb, Jug, and Vit represent Cycas panzhihuaensis, Amborella trichopoda, Juglans regia, and Vitis vinifera. Black dots show original or normalized bit-scores while red lines show fitted linear regressions. (a) Relationship between original bit-score and gene length of all hits for different species pairs. (b) Relationship between original bit-score and gene length of upper 5% hits per bin for different species pairs. (c) Relationship between normalized bit-score and gene length of all hits for different species pairs. (d) Number of mis-assigned genes, and (e) family size per paralogous gene family category in mean.

