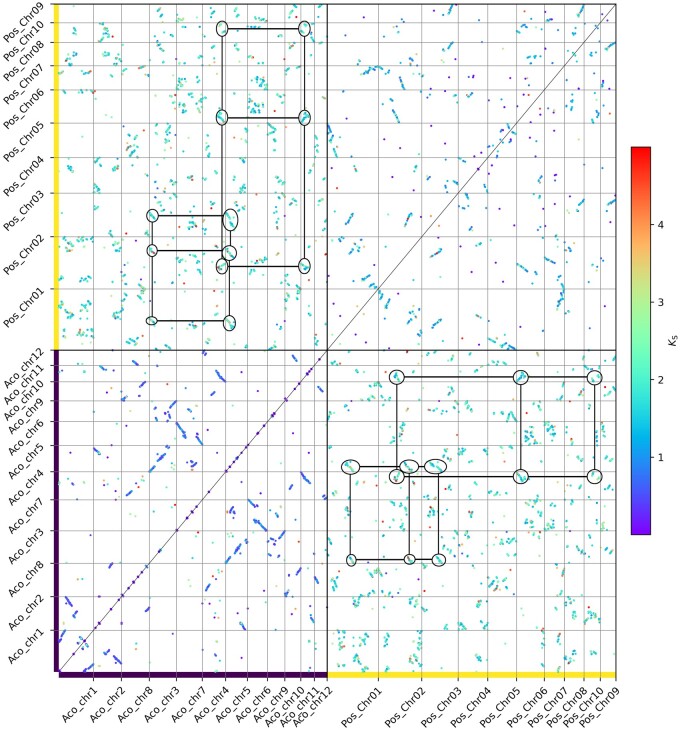
Figure 4.
Intraspecific and interspecific genome homology dot plots for Acorus tatarinowii and Posidonia oceanica. Anchor pairs (homologous genes residing in homeologous segments) are represented as dots colored by their associated KS value. Axes show genes on corresponding chromosomes. Marked circles denote collinear regions—with a ratio of 2:3—between A. tatarinowii and P. oceanica.

