Figure 5.
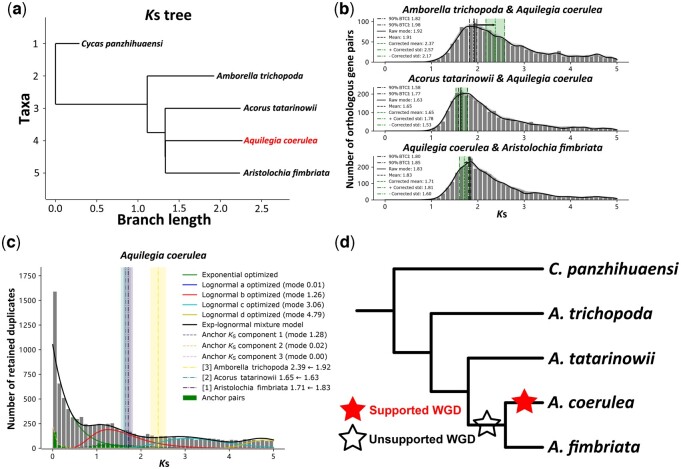
Synonymous substitution rate correction. (a) Inferred KS tree showing the different synonymous substitution rates across branches (in particular between Amborella and the others) with focal species Aquilegia coerulea marked in red. (b) The orthologous KS distributions between the focal species A. coerulea and three other sister species, with the mode of the fitted KDE on the “raw” KS distribution marked by the black solid line; the mean and the 90% confidence interval of the mode from 200 bootstrap replicates marked by the black dashed and dash-dotted lines (BTCI); the mean and mean ± std of the corrected mode marked by the green dashes and dash-dotted lines with the area between the mean − std and mean + std filled in green; the direction of rate correction marked as black arrow; the KDE curve of 200 bootstrap replicates plotted in gray, and the KDE curve of the “raw” KS distribution plotted in black. (c) KS age distribution for the paranome of A. coerulea, with the inferred components of mixture modeling analysis of the whole-paranome and anchor pair KS distribution plotted as solid and dashed lines and the corrected divergence times marked by the dash-dotted lines with the associated standard deviation. (d) The proposed scenario of the phylogenetic location of the WGD event in the A. coerulea lineage based on the results of mixture modeling and rate correction analysis (see text for details) illustrated in the cladogram.

