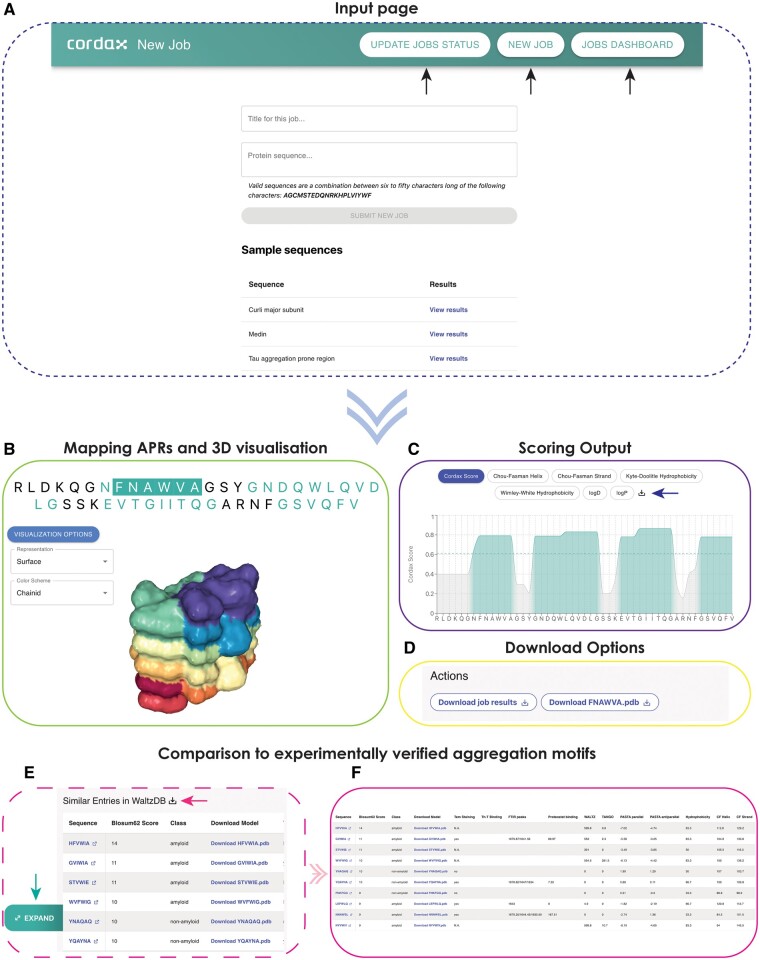
Figure 1.
The Cordax web server interface. (A) Users can submit new jobs or track current and previous jobs through dedicated buttons on the webserver title page (indicated by arrows). Job submission requires a protein sequence as input, with an optional title. (B–F) Representative example of the information provided as output by the Cordax webserver. (B) The main interaction panel of the output page shows the query sequence, with predicted aggregation-prone regions highlighted. By selecting identified hexapeptide sequences, users can activate the 3D visualization plugin indicating the predicted steric zipper topology of the segment. (C) The scoring plot indicates by default the Cordax score per residue but can also be used to plot additional relevant sequence propensities. Users can access per-residue information through a box that appears by browsing over the query sequence shown on the x-axis. Access to the raw data is also provided through a download option (arrow). (D) Download options for information shown in (B and C) are also provided in the “Actions” submenu. (E) For predicted hexapeptides selected from the query sequence shown in (A), an interactive table is generated with experimentally determined aggregation-prone regions derived from WALTZ-DB (Louros et al. 2020) that are sorted based on sequence similarity scores. Information contained can be access using the download option at the top of the table (left-directed arrow). Using the expand option (down arrow), (F) a pop-up window appears for improved visualization of the table contents.

