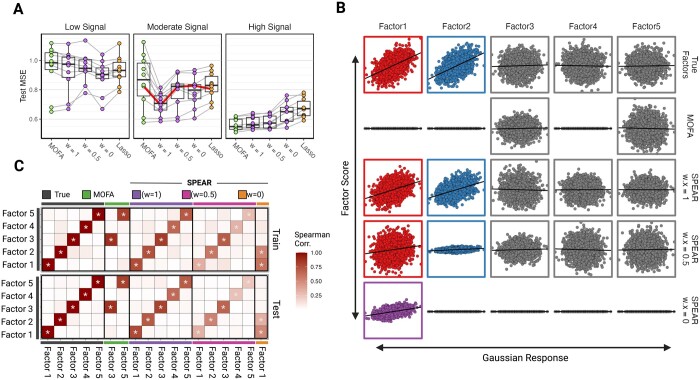
Figure 2.
Gaussian simulation results. (A) Boxplots of mean-squared errors of the models on the testing data. MSE results for each simulated iteration are connected. Results are shown for varying signal-to-noise ratios, including low, moderate, and high signals. (B) Scatterplots of various factor scores (y-axis) against the true Gaussian response (x-axis) of the moderate signal test data. Color is applied to factor scores found to be correlated with true factors 1 (red) and 2 (blue) with true factors 3–5 designated as grey. (C) Correlation matrix showing the Spearman correlation between each derived factor of the true factors for both the training and testing data of the moderate signal simulated dataset. Significant correlations are denoted with *P ≤ 0.001

