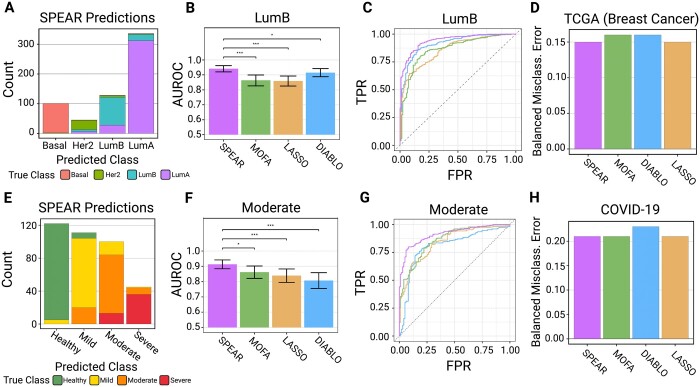
Figure 3.
TCGA-BC Tumor Subtype and COVID-19 Severity Prediction Results. (A, E) Test sample class predictions of the SPEAR model, colored by true class. (B, F) Multi-class AUROC statistics for each model for the LumB and Moderate classes. Error bars show the 95% confidence interval found via 2,000 stratified bootstrapping replicates. Significance testing is denoted as *P ≤ 0.05), **P ≤ 0.005, and ***P ≤ 0.0005. (C) AUROC plot for all models predicting LumB subtype. (G) AUROC plot for all models predicting the moderate severity class. (D, H) Balanced misclassification errors of SPEAR, MOFA, DIABLO, and Lasso on test samples from the (D) TCGA (Breast Cancer) dataset and (H) COVID-19 dataset

