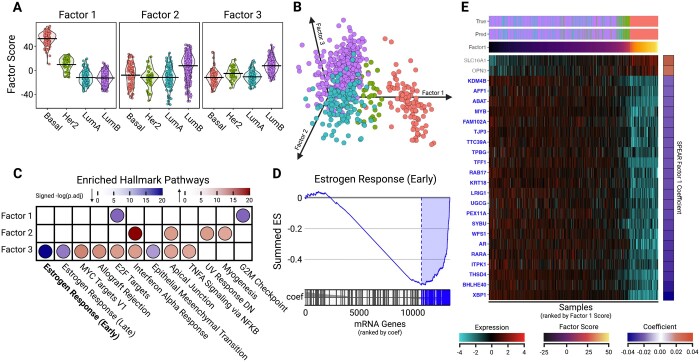
Figure 4.
Downstream TCGA-BC Analysis. (A) Grouped violin plot of Factors 1–3 scores (y-axis) and tumor subtype (x-axis), with group means marked with a line. (B) 3D scatter plot, embedding samples by Factors 1, 2, and 3 scores. Samples are colored by tumor subtype. (C) Dotplot of GSEA results on mRNA features for Factors 1–3. Points are shaded by −log(P.adjusted) with color representing enrichment direction. (D) GSEA plot for Estrogen Response (Early) Hallmark pathway for SPEAR Factor 1. mRNA genes are ranked by their assigned projection coefficient from SPEAR Factor 1. (E) Heatmap showing normalized expressions for the top 24 mRNA genes involved in the Estrogen Response (Early) Hallmark pathway. mRNA genes were selected with a factor loading (projection coefficient) magnitude ≥0.02. Samples were ranked by Factor 1 score (x-axis) and genes were ranked by projection coefficient (y-axis). Also shown are corresponding true tumor subtypes (True) and SPEAR-predicted tumor subtypes (Pred)

