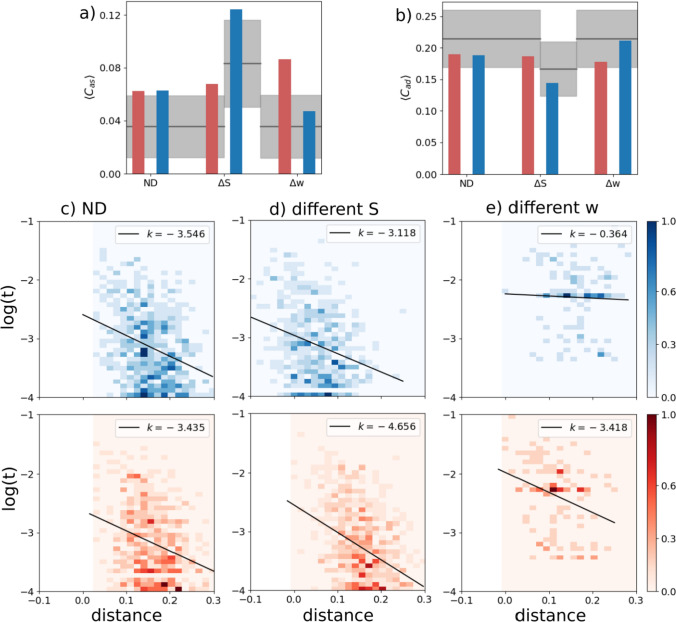
Fig. 2.
A latching frontal network leads a non-latching posterior network. Red indicates the frontal and blue the posterior network in this and other figures. a and b The transition-weighted averages of and are compared to their baseline values for three cases: no difference between the two networks (ND, leftmost bars), a difference in S (, middle bars) and a difference in w (, rightmost bars). The gray horizontal line and shaded area indicate the baseline average and its standard deviation. c–e Scatterplots of (log) transition frequencies between individual patterns pairs versus their “distance”, for the three conditions. The darkness of color indicates the number of pairs at each combination of abscissa and ordinate. For the ND condition, parameters are set as , . For the other conditions, the parameters of the frontal network are kept the same as in the ND condition, while the parameters of the posterior sub-network are set as and , respectively, in (d) and (e). Note the negative values on the x-axis, particularly in panel (d) upper, due to using just a proxy of a proper distance measure, a proxy which reaches in the negative range when

