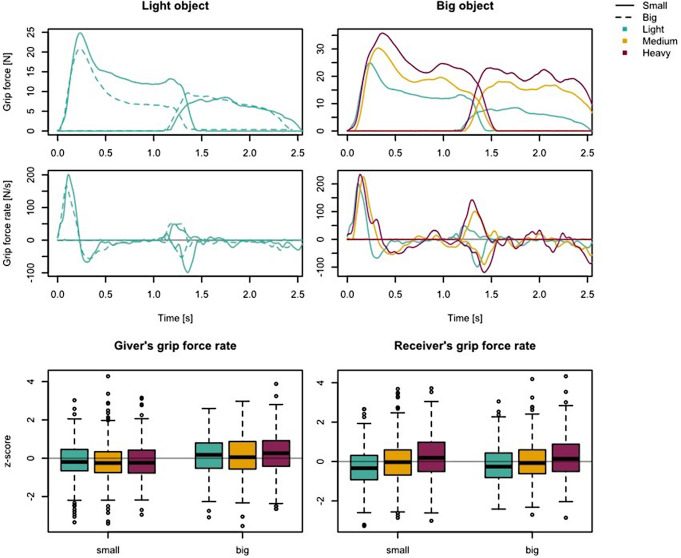
Fig. 5.
The plotted data are from one dyad (giver and receiver) and aligned to the time of initial contact between giver and object. The left column shows the two trials using the light object weight and the two different object sizes. The right column shows three trials using the big object and the three different object weights (400 g, 700 g, 1000 g). At the bottom the boxplots showing the giver’s and receiver’s z-score normalized grip force rates. Values greater/smaller than 1.5 time of the interquartile range of the third/first quartile were marked by circles as outliers

