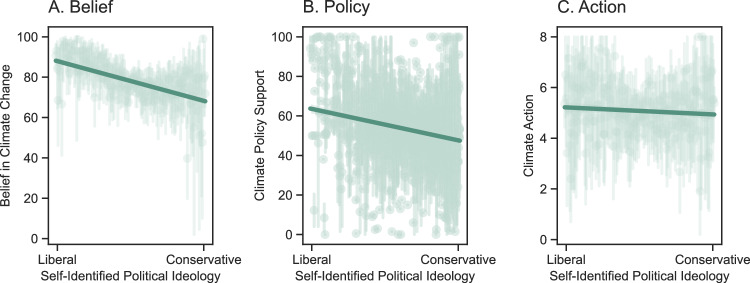
Fig. 1. Climate change belief, policy support, and action predicted by self-reported political ideology.
Belief in climate change (Panel A), climate policy support (Panel B), and climate action (Panel C), as a function of self-reported political ideology (measured from 0 = liberal to 100 = conservative), in the control condition (N = 4302). Vertical lines represent 95% bootstrapped confidence intervals of the means at each level of political ideology; Fitted lines represent the best fit linear regression lines.

