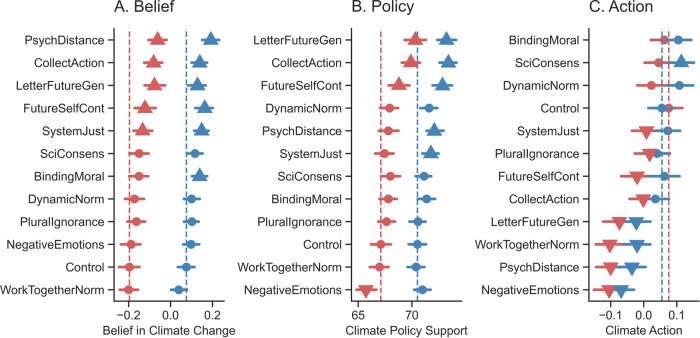
Fig. 4. Impact of each intervention on climate change beliefs, policy support, and action, separated by self-reported political ideology.
Interventions’ impacts on climate beliefs (Panel A), policy support (Panel B), and action (Panel C), split by self-reported political ideology (liberals in blue and conservatives in red; N = 51,224). Vertical lines indicate the average in the control condition for each ideological grouping. Error bars represent 95% confidence intervals of the means. Upward triangles indicate significant increases, downward triangles indicate significant decreases, and circles indicate no statistically significant differences, always compared to the control.

